. 2025 Apr 26;15(1):14645.
doi: 10.1038/s41598-025-97573-4.

Structure function in photoplethysmographic signal dynamics for physiological assessment

Affiliations

Structure function in photoplethysmographic signal dynamics for physiological assessment

Javier de Pedro-Carracedo et al. Sci Rep. .

Abstract

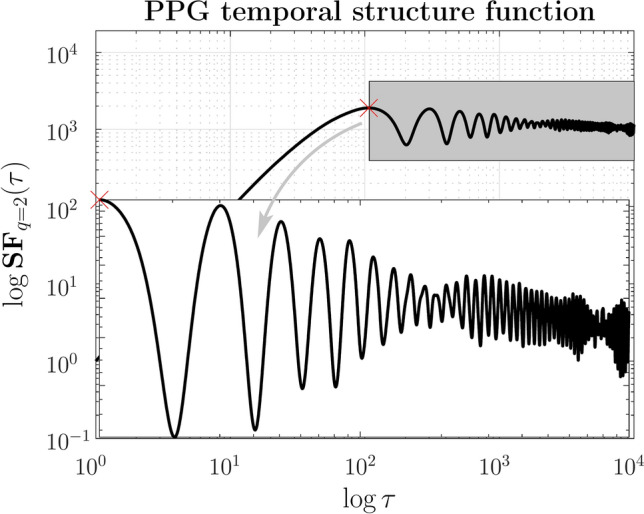
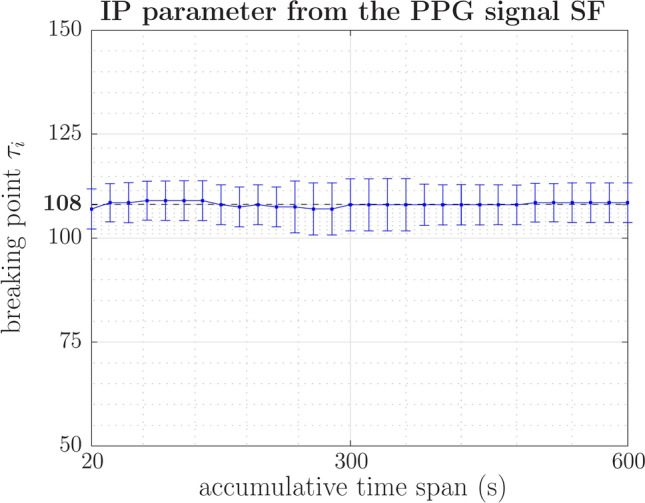
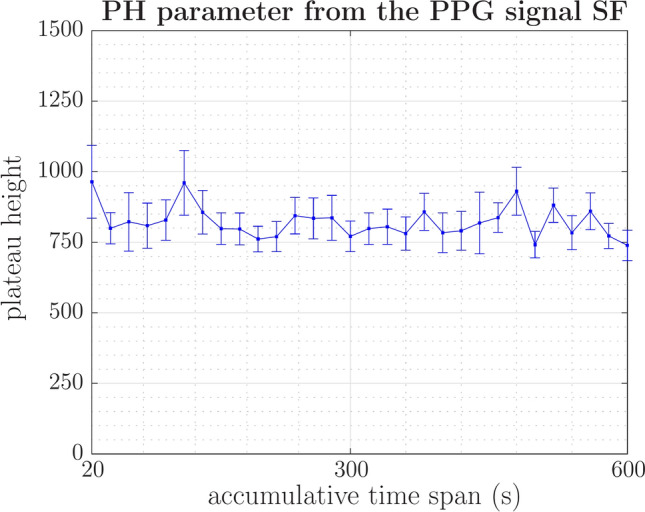
Physiological systems are inherently complex, driven by non-linear interactions among various subsystems that govern their function across diverse spatiotemporal scales. Understanding this interconnectedness is crucial; in this sense, the structure function enables us to dissect the dynamic intricacies of biological responses. By examining amplitude fluctuations across different timescales, we can gain valuable insights into the variability and adaptability of these vital systems. A structure function serves as an essential tool for uncovering long-term correlations that highlight self-organizing behavior. Additionally, it effectively examines the fractal characteristics of short-term signals influenced by the measurement noise often present in biological data. This paper presents a novel investigation into how various parameters of the structure function of the PhotoPlethysmoGraphic (PPG) signal can serve as reliable physiological biomarkers indicative of an individual's cardiorespiratory activity level. Preliminary tests on 40 students from the Universidad Politécnica de Madrid (UPM), all young and healthy individuals aged between 19 and 30, yielded promising results. These findings enhance our understanding of PPG signal dynamics from a physiological standpoint and provide a procedural framework for real-time patient monitoring and health assessment in clinical environments.

Keywords: Complexity; PPG signal; Physiological biomarkers; Structure function.


Conflict of interest statement

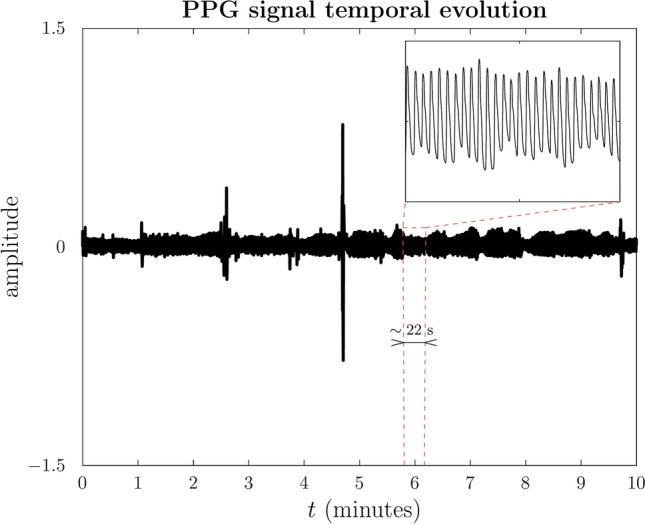
Declarations. Competing interests: The authors declare no competing interests. Ethics approval and consent to participate: The data used in this study come from the FIS-PI12/00514 project at the Universidad Politécnica de Madrid (UPM). It was conducted according to the guidelines of the Declaration of Helsinki and approved by the Institutional Review Board (or Ethics Committee) of the UPM (protocol code 2014-16-06 and date of approval 16 July 2014). The study includes 40 students from the UPM between 18 and 30 years old. All signals are captured from the middle finger of the left hand and sampled at a frequency of 250 Hz, say, sampling time $$\Delta t = 4$$ ms. The UPM Ethics Committee approved the study protocol. Participants gave their written informed consent. They were instructed to avoid using any psychotropic substance, alcohol or tobacco, avoid physical exercise 24 hours before each session, get up two hours before starting the sessions and consume a light breakfast without coffee or tea.

Figures

Fig. 1
Fig. 1
Segment of a PPG signal sample as acquired instrumentally. The ten minutes are taken from the center of the basal session, which has a data acquisition time of 60 minutes. Non-stationary is evident over both long and short timescales. Different parts of the signal differ in amplitude and frequency variations. The observed peaks likely indicate sudden and involuntary movements of the finger upon which the sensor is positioned. Finger misalignment is anticipated to exacerbate the noise level in the observation.
Fig. 2
Fig. 2
Segment of a PPG signal sample as acquired instrumentally. The three seconds represented are taken from Figure 1. Different parts of the signal exhibit variations in DC, AC amplitude, and frequency. The non-pulsatile or direct current (DC) component is determined by calculating the mean of the minimum values from each photoplethysmography (PPG) cycle, as represented by the formula formula image. In this context, i denotes the index of the i-th PPG cycle. The AC component, or pulsatile component, is calculated as the mean of the maximum value from each PPG cycle, subtracting the DC component. Thus, formula image. The baseline is the minimum value among all cycles. The values depicted in the graph are a short section of the 10-minute signal shown in Figure 1.
Fig. 3
Fig. 3
In relaxation conditions (basal level), formula image is nearly linear for moments greater than 1, a signature of a monofractal process. The exponent, formula image, is calculated for a range of q values identifying the moment of the statistic, which, in this case, refers to the temporal structure function. Each data point derives from Eq. 3, where the value of formula image represents the average scaling exponent of formula image in Eq. 1, across the 40 subjects. A slight oscillatory modulation is seen for formula image (highlighted in light red). With a more in-depth investigation, periodic modulation could unveil a phase transition in anomalous diffusion processes.
Fig. 4
Fig. 4
Examples of temporal structure function, formula image (Eq. 1) versus formula image with formula image on a log-log plot, from different types of signals: (a) The purple box represents Region 12 of El Nino, as indicated by the Copernicus program (Copernicus Earth Observation Programme), precisely the values of the SST (Sea Surface Temperature) variable included in OSTIA (Operational Sea Surface Temperature and Ice Analysis) global sea surface temperature product; the sea surface temperature data used are from a variant of El Nino Region 12 limited to an area near the coast of Peru, highlighted in emerald. (b) and (c) are from the MUSAN music, speech, and noise corpus; (b) is a tone whose frequency increases, and (c) noise-free-sound 0005. (d) PPG signals from two subjects in basal state, in a 0.5–15 Hz frequency range. The three signals presenting complexity (a), (c), and (d) initially slope upward (correlated signal) before reaching a plateau on large timescales (apparently uncorrelated). The dynamic fluctuation on this plateau is consistent with stochastic behavior as it is (b) signal.
Fig. 5
Fig. 5
A characteristic outline of the temporal structure function observed in PPG signals. At large timescales, an upward initial slope up to the breaking point formula image is followed by a flat region. The inflection point, memory limit formula image, to the point at which the structure function experiences a change in its concavity for the first time. The scaling exponent is determined by the slope of the straight line connecting the structure function’s initial point and inflection point. The plateau height relates to the average variation in the structure function, from the inflection point to the end of the dataset used for estimation. The dynamic fluctuation in this plateau is consistent with stochastic behavior.
Fig. 6
Fig. 6
Zoom from Figure 5. At large timescales, the temporal structure function of PPG signals displays a slope of roughly zero. However, the seemingly erratic fluctuation hides a dynamical response function with a characteristic power-law 1/f-like behavior, as illustrated in the inset.
Fig. 7
Fig. 7
PPG signal sample with a temporal structure function showing a non-zero slope at small timescales. Fluctuation variability has a non-linear behavior. At large timescales, the random behavior (with a temporal structure function showing an average zero-slope) is superimposed on an oscillatory behavior that resembles an amplitude and frequency modulation. Differentiating observations, see Eq. 1, at a specific time interval formula image helps reduce low-frequency noise, while averaging cancels high-frequency noise. The initial region of the temporal structure function with a non-zero slope disappears in the scrambled data, in which case the whole function shows a zero slope (random behavior).
Fig. 8
Fig. 8
The temporal structure function of a raw PPG signal (solid blue line) and the same PPG signal but filtered using a bandpass filter array with different lower cutoff frequencies (see legends on the right side of the Figure). At small timescales, the initial slope is almost identical for all signals, but not the breaking point (memory limit), which only is held until the non-linear coupling between respiration and heart rate (lower cutoff frequencies formula image 1 Hz) is broken and only the proper correlation of heart rate harmonics is preserved. In this work, we use the filtered PPG signal within the range of 0.5 to 15 Hz (solid red line) because, as you can see, the envelope qualitatively captures the low-frequency variations.
Fig. 9
Fig. 9
In the study involving 40 healthy young individuals under relaxed conditions, the mean value of the scaling exponent (SE) exhibited minimal variation. The standard error of the mean (SEM) remained consistently low and stable throughout the 10-minute analysis period, showing no fluctuations. The graph shows the baseline level for random behavior (formula image).
Fig. 10
Fig. 10
In the study involving 40 healthy young individuals under relaxed conditions (basal level), the mean value of the inflection point (IP) and, therefore, the prediction horizon remained nearly constant. The standard error of the mean (SEM) remained consistently low throughout the 10-minute analysis period.
Fig. 11
Fig. 11
In the study involving 40 healthy young individuals under relaxed conditions, the mean value of the plateau height (PH) and the standard error of the mean (SEM) varied but remained within a consistent range during the 10-minute analysis period. The characteristic outline of temporal structure function on this plateau is consistent with stochastic behavior.

Similar articles

References

    1. Webster, J. G. (ed.) Design of pulse oximeters. Medical science series (Inst. of Physics Publ., 1997), 1st edn.
    1. Allen, J. Photoplethysmography and its application in clinical physiological measurement. Physiol. Meas.28, R1–R39. 10.1088/0967-3334/28/3/r01 (2007). - PubMed
    1. Noah, B. et al. Impact of remote patient monitoring on clinical outcomes: an updated meta-analysis of randomized controlled trials. NPJ Digit. Med.1, 20172. 10.1038/s41746-017-0002-4 (2018). - PMC - PubMed
    1. Moraes, J. et al. Advances in photopletysmography signal analysis for biomedical applications. Sensors.18, 1894. 10.3390/s18061894 (2018). - PMC - PubMed
    1. Park, J., Seok, H. S., Kim, S.-S. & Shin, H. Photoplethysmogram analysis and applications: An integrative review. Front. Physiol.12, 10.3389/fphys.2021.808451 (2022). - PMC - PubMed

LinkOut - more resources