. 2025 Apr 26;74(6):185.
doi: 10.1007/s00262-025-04027-x.

Dynamics of tertiary lymphoid structures and immune cross talk in early versus advanced colorectal cancer: potential implications for immunotherapy

Affiliations

Dynamics of tertiary lymphoid structures and immune cross talk in early versus advanced colorectal cancer: potential implications for immunotherapy

Zixu Chen et al. Cancer Immunol Immunother. .

Abstract

Background: Irrespective of microsatellite status, immune checkpoint inhibitor therapy shows superior efficacy in early-stage colorectal cancer (CRC) compared to advanced cases. The distinctions of the tumor microenvironment (TME) and tertiary lymphoid structure (TLS) between early- and advanced-stage CRC may represent a critical factor, yet remain incompletely elucidated.

Methods: We comprehensively analyzed single-cell RNA sequencing data, bulk RNA transcription data and pathological tissue data to investigate the dynamic changes in the TME. The features of TLS in early- and advanced-stage tumors and their potential impact on immunotherapy were explored using three in-house cohorts.

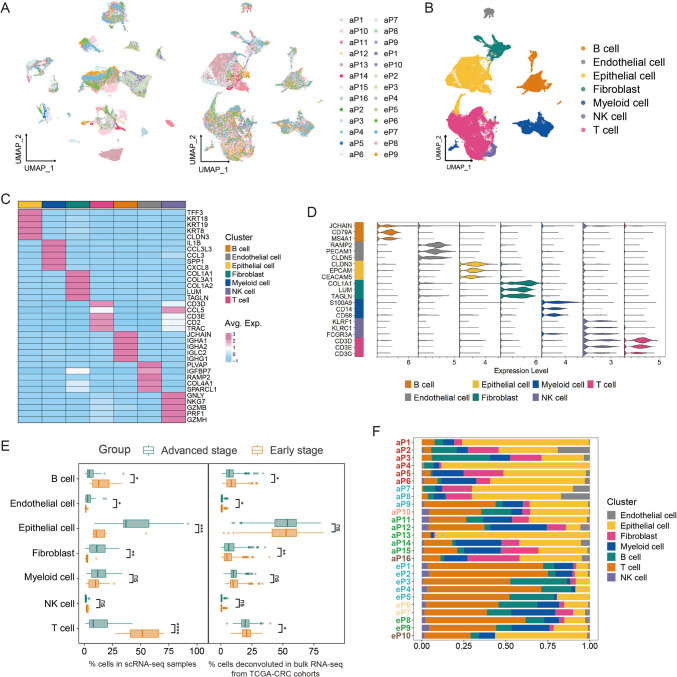
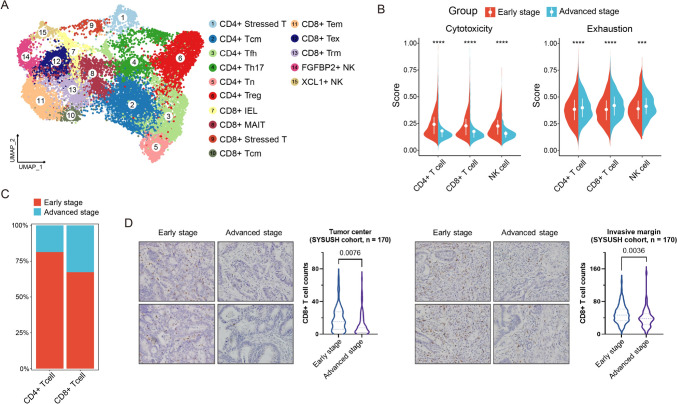
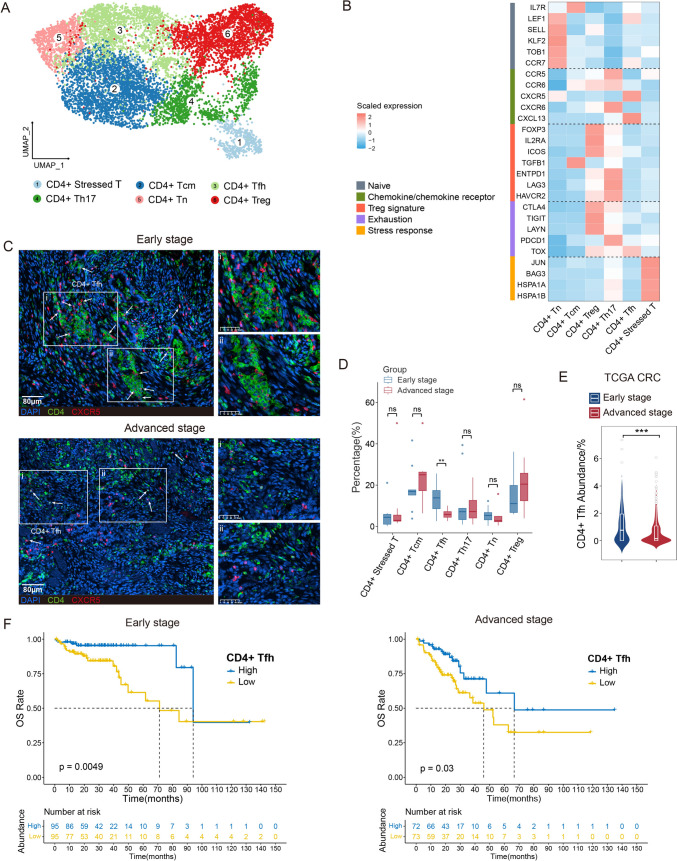
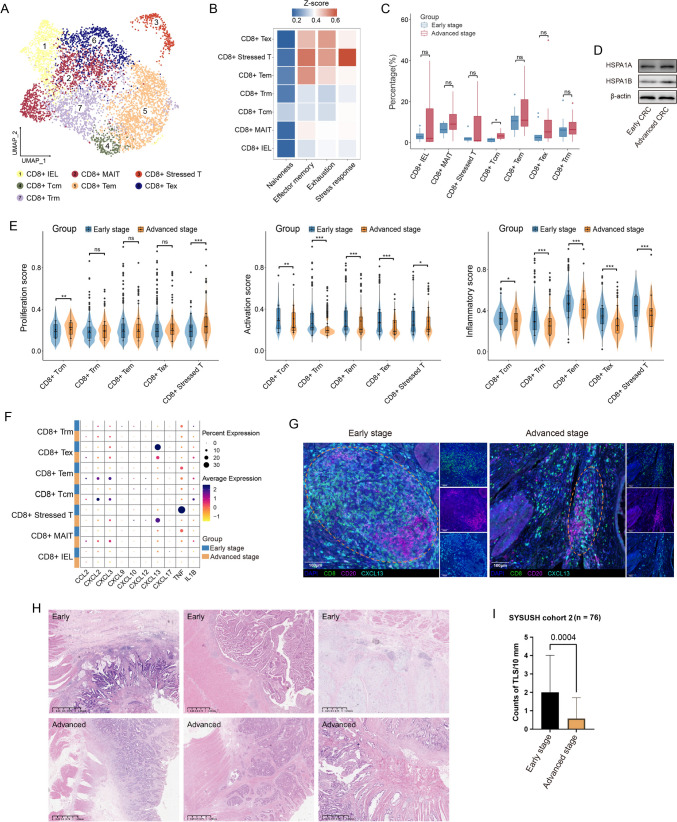
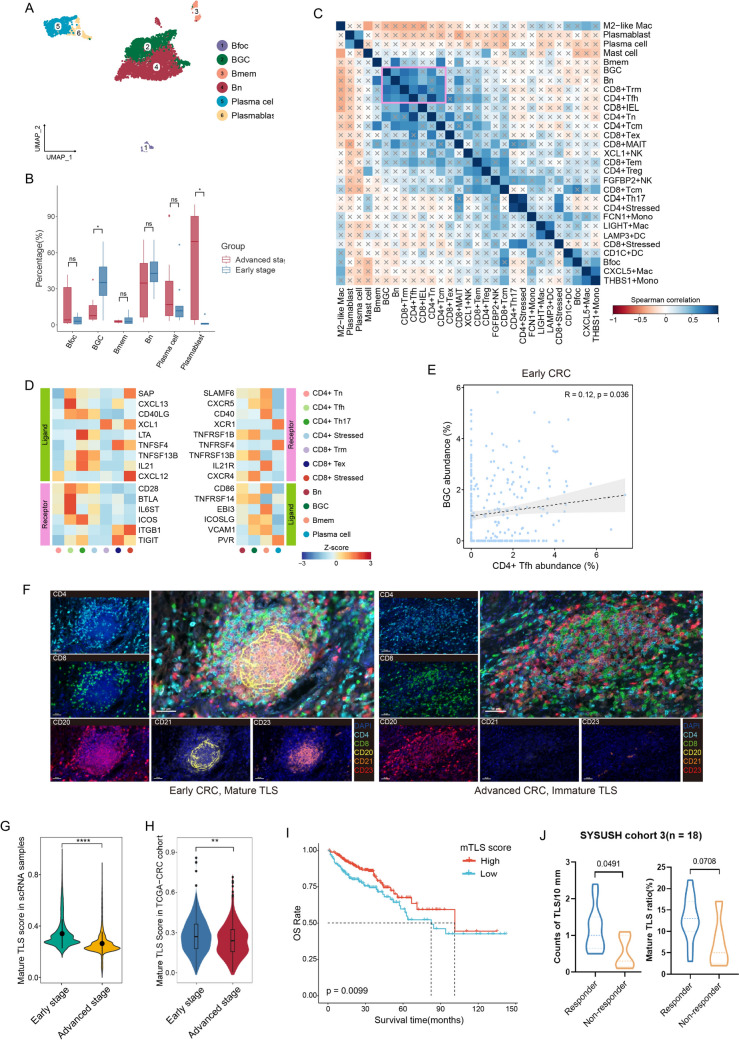
Results: We provided single-cell fine maps of the immune landscape in early and advanced CRC. Significant functional differences were identified in CD4 + Tfh and BGC cells between early and advanced CRC. We revealed CXCL13 expression on CD8 + Tex cells, along with CD40-CD40L interactions between CD4 + Tfh and BGC cells, could be key regulators of TLS functionality and subsequently affect the response to immunotherapy.

Conclusions: Our research shed light on the multilayered immune dysfunction in advanced CRC and elucidates the alterations in the TLS during the progression of CRC, providing insights for functional studies and the exploration of potential target in advanced CRC.

Keywords: Colorectal cancer; Immunotherapy; Tertiary lymphoid structure; Tumor microenvironment.


Conflict of interest statement

Declarations. Conflict of interest: The authors have declared that no conflict of interest exists. Ethics approval and consent to participate: This study was approved by the Ethics Committee of the Sixth Affiliated Hospital of Sun Yat-sen University (2022ZSLYEC-143). The procedures for human sample collection were approved by the Ethics Committee of the Sixth Affiliated Hospital of Sun Yat-sen University. Consent for publication: All the authors have signed the form of consent to publication.

Figures

Fig. 1
Fig. 1
Single-cell landscape of colorectal cancer from early- and advanced-stage CRC patients. A UMAP plots of cells from 26 CRC samples before (left) and after (right) the integration analysis of single-cell data from different GEO datasets. B UMAP plot showing the seven broad cell types in CRC samples. C Heatmap displaying average expression of differentially expressed genes (DEGs). For each cluster, the top five genes and their relative expression levels in all CRC cells are shown. D Violin plot displaying the expression of known canonical marker gene across diverse cell types in CRC samples. E Box plot showing the fraction of cell types that originated from each patient. Leftmost on the plot corresponds to patient IDs. IDs starting with “e” denote early-stage CRC patients, “a” represents advanced-stage CRC patients, and different colors signify patients from distinct GEO datasets. F Box plots showing the cell-type abundance for samples from different patient groups, as measured by scRNA-seq data or deconvoluted bulk RNA-seq from TCGA CRC cohort. P values are calculated by two-sided Wilcoxon test. *p < 0.05; **p < 0.01; ***p < 0.001; ****p < 0.0001; ns, not significant
Fig. 2
Fig. 2
The TME of early-stage CRC exhibits higher effector activity and greater immune cell infiltration. A UMAP plots of T and NK cell subsets. B Semi-violin plots of the average cytotoxic and exhausted signature scores for CD4 + T, CD8 + T and NK cells in early- and advanced-stage CRC samples. P values are calculated using two-sided Wilcoxon test. C Fraction of CD4 + T and CD8 + T cells in early- and advanced-stage CRC. D Representative IHC images of CD8 staining in the center (left) or on the margin (right) of early- and advanced-stage CRC from SYSUSH cohort and corresponding quantification data are presented by violin plot showing the differential CD8 + T cell infiltration between two groups. Two-sided t-test. ***p < 0.001; ****p < 0.0001
Fig. 3
Fig. 3
Differences of compositions and functions in CD8 + T cells from early- and advanced-stage CRC. A UMAP plot of CD4 + T cell subsets. B Heatmap displaying expression of markers associated with naïve/chemokine or chemokine receptor/Treg signature/exhaustion/stress response across CD4 + T cell subsets. C mfIHC image of CD4 (green) and CXCR5 (red) in human CRC tissues, counterstained with DAPI (blue). Scale bars: 80 μm. White arrows indicate individual CD4 + Tfh cells. White dashed boxes denote regions enriched with CD4 + Tfh cell clusters, which are magnified in panels i and ii. D Box plots showing cellular fractions of each CD4 + T cell subset in CD4 + T cells from early- and advanced-stage CRC samples. E Comparison of CD4 + Tfh cell abundance in early- and advanced-stage CRC from TCGA CRC cohort. F Kaplan–Meier analysis of overall survival (OS) in early-stage (left) and advanced-stage (right) CRC patients from TCGA CRC cohort, with patients separated by high and low CD4 + Tfh cell abundance in bulk RNA-seq. Survival curves are compared by the log-rank test. P values are calculated using two-sided Wilcoxon test (D and E). **p < 0.01; ***p < 0.001; ns, not significant
Fig. 4
Fig. 4
Characteristics of CD8 + T cell subsets and TLSs in early and advanced CRC. A UMAP plot of CD8 + T cell subsets. B Heatmap of signature scores of naïve, effector memory and exhaustion among CD8 + T cell subsets. C Box plots showing cellular fractions of each CD8 + T cell subset in CD8 + T cells from early- and advanced-stage CRC samples. D Western blotting for measuring the protein expressions of HSPA1A and HSPA1B in the tumor tissues from early and advanced CRC. E Expression levels of 3 gene signatures across CD8 + T cell subsets from early and advanced CRC tissues. F Bubble plot of cytokine and IL-1β expression among CD8 + T cell subsets from early and advanced CRC. G Expression of CXCL13 by CD8 + T cells in early- and advanced-stage CRC TME. The TLS structure is characterized by an aggregation of CD20 + B cells and CD8 + T cells. H Representative H&E image of TLS in early and advanced CRC. I Comparisons of average TLS densities at the invasive front line between early- and advanced-stage CRC from SYSUSH cohort 2. Two-sided t-test. P values are calculated by two-sided Wilcoxon test (C and E). *p < 0.05; **p < 0.01; ****p < 0.0001; ns, not significant
Fig. 5
Fig. 5
BGC and CD4 + Tfh cells concertedly expand and more mature TLSs are observed in early CRC. A UMAP plots of B cells colored and labeled by subsets. B Box plots comparing the cellular proportions of each subset of B cells between early- and advanced-stage CRC. P values are calculated using two-sided Wilcoxon test. C Correlation heatmap of immune cell frequencies in CRC. x represents no correlation between the two corresponding cell types. D Heatmap showing the expression of ligand–receptor pairs highly expressed in B and T cells. E Scatterplots showing the Spearman correlation of CD4 + Tfh cell abundances with BGC cell abundances of early CRC in TCGA CRC data. F Representative mfIHC images of mature (left) and immature TLS (right) from early and advanced CRC, respectively. Scale bars, 50 μm. G-H Violin plots comparing mature TLS score distributions between early- and advanced-stage CRC in single-cell sequencing data (G) and TCGA CRC data (H). I Kaplan–Meier plots of OS among patients with high and low mTLS score in TCGA CRC cohort. Survival curves were compared by the log-rank test. J Comparisons of average TLS densities (left) and mature TLS ratios (right) at the invasive front line between responders and non-responders for neoadjuvant anti-PD-1 therapy from SYSUSH cohort 3. *p < 0.05; **p < 0.01; ****p < 0.0001; ns, not significant

Similar articles

References

    1. Chalabi M, Fanchi LF, Dijkstra KK, Van den Berg JG, Aalbers AG, Sikorska K, Lopez-Yurda M, Grootscholten C, Beets GL, Snaebjornsson P, Maas M, Mertz M, Veninga V, Bounova G, Broeks A, Beets-Tan RG, de Wijkerslooth TR, van Lent AU, Marsman HA, Nuijten E, Kok NF, Kuiper M, Verbeek WH, Kok M, Van Leerdam ME, Schumacher TN, Voest EE, Haanen JB (2020) Neoadjuvant immunotherapy leads to pathological responses in MMR-proficient and MMR-deficient early-stage colon cancers. Nat Med 26(4):566–576 - PubMed
    1. Yang X, Yin R, Xu L (2018) Neoadjuvant PD-1 blockade in resectable lung cancer. N Engl J Med 379(9):e14 - PubMed
    1. Huang AC, Orlowski RJ, Xu X, Mick R, George SM, Yan PK, Manne S, Kraya AA, Wubbenhorst B, Dorfman L, D’Andrea K, Wenz BM, Liu S, Chilukuri L, Kozlov A, Carberry M, Giles L, Kier MW, Quagliarello F, McGettigan S, Kreider K, Annamalai L, Zhao Q, Mogg R, Xu W, Blumenschein WM, Yearley JH, Linette GP, Amaravadi RK, Schuchter LM, Herati RS, Bengsch B, Nathanson KL, Farwell MD, Karakousis GC, Wherry EJ, Mitchell TC (2019) A single dose of neoadjuvant PD-1 blockade predicts clinical outcomes in resectable melanoma. Nat Med 25(3):454–461 - PMC - PubMed
    1. Tang YQ, Chen TF, Zhang Y, Zhao XC, Zhang YZ, Wang GQ, Huang ML, Cai SL, Zhao J, Wei B, Huang J (2020) The tumor immune microenvironment transcriptomic subtypes of colorectal cancer for prognosis and development of precise immunotherapy. Gastroenterol Rep (Oxf) 8(5):381–389 - PMC - PubMed
    1. Li J, Wu C, Hu H, Qin G, Wu X, Bai F, Zhang J, Cai Y, Huang Y, Wang C, Yang J, Luan Y, Jiang Z, Ling J, Wu Z, Chen Y, Xie Z, Deng Y (2023) Remodeling of the immune and stromal cell compartment by PD-1 blockade in mismatch repair-deficient colorectal cancer. Cancer Cell 41(6):1152–69.e7 - PubMed

MeSH terms