. 2025 Apr 26;8(1):667.
doi: 10.1038/s42003-025-07934-y.

Nanocrystalline cellulose-geniposide complex enhances gut-brain axis modulation for depression treatment

Affiliations

Nanocrystalline cellulose-geniposide complex enhances gut-brain axis modulation for depression treatment

Tianyu Zou et al. Commun Biol. .

Abstract

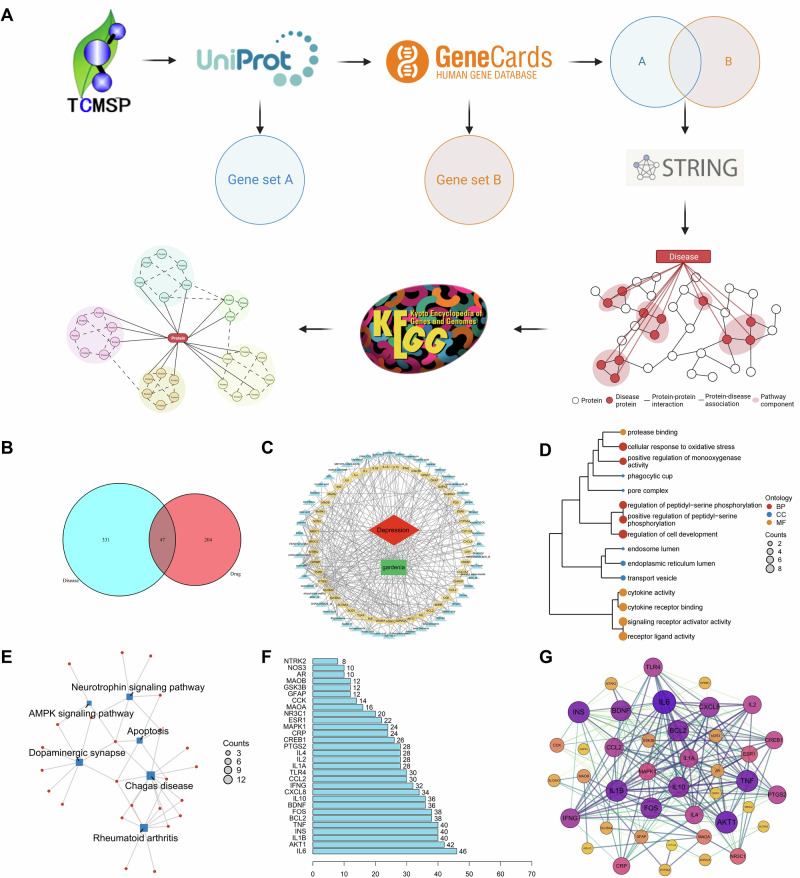
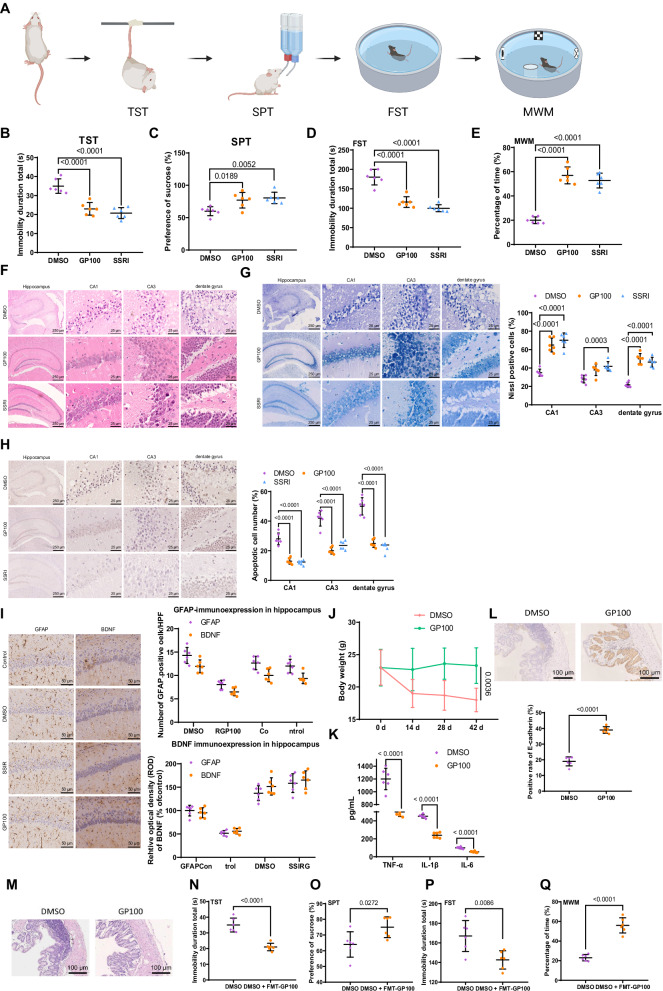
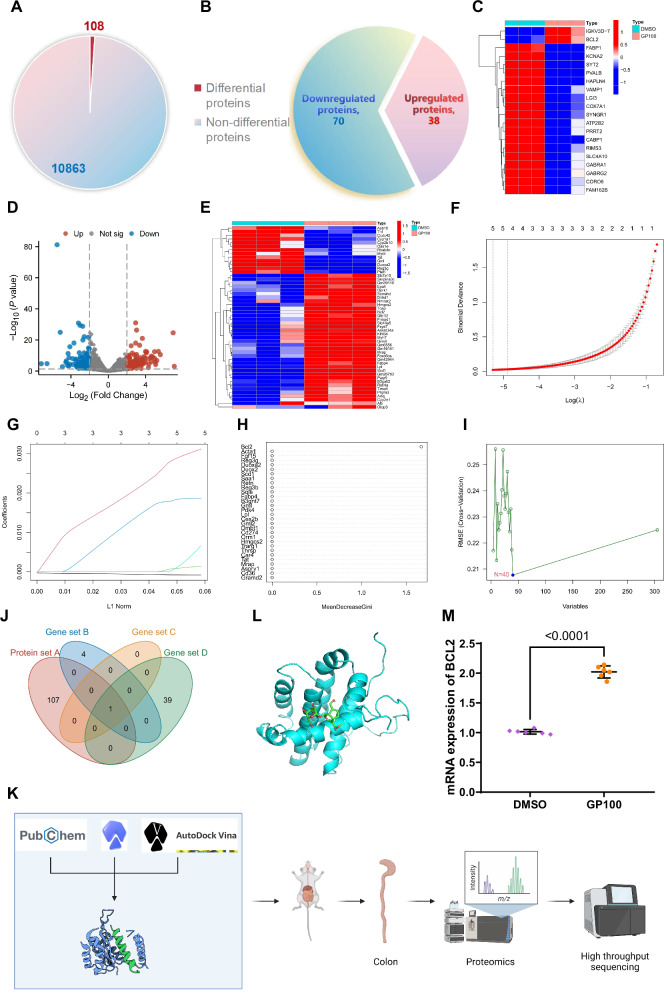
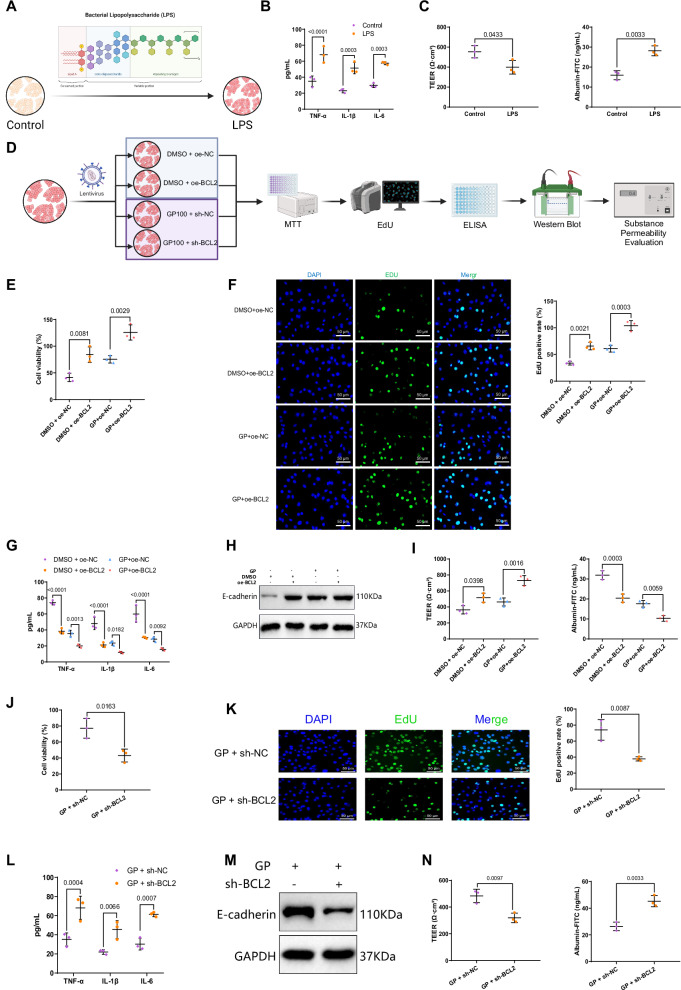
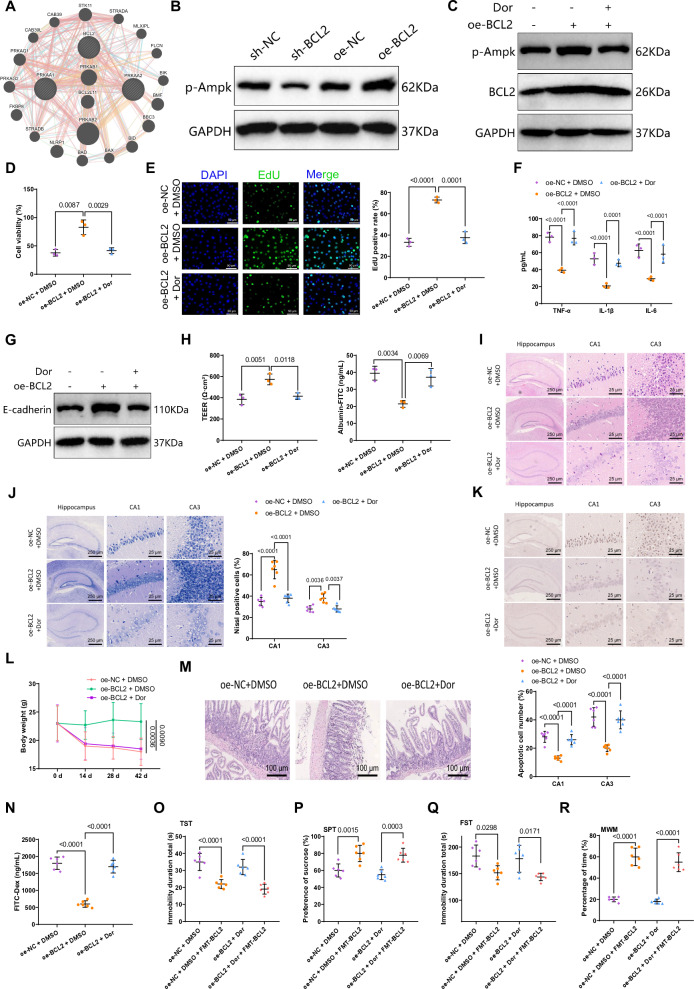
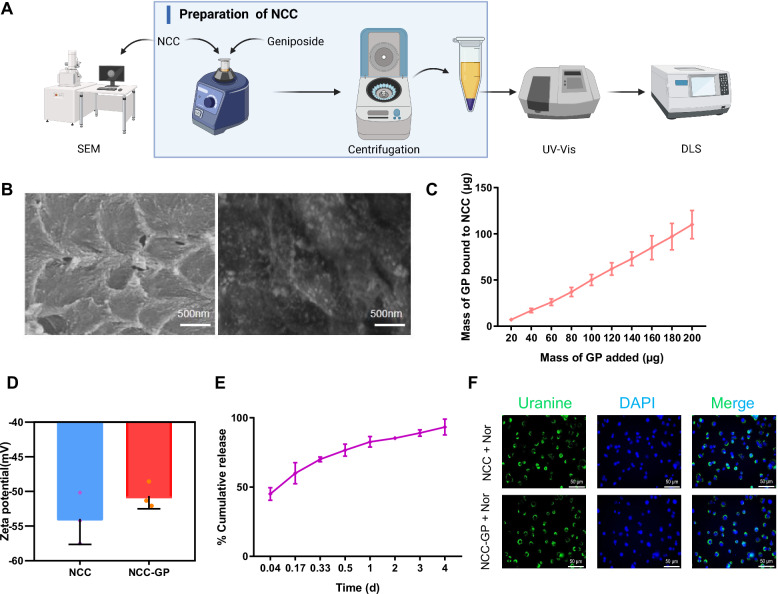
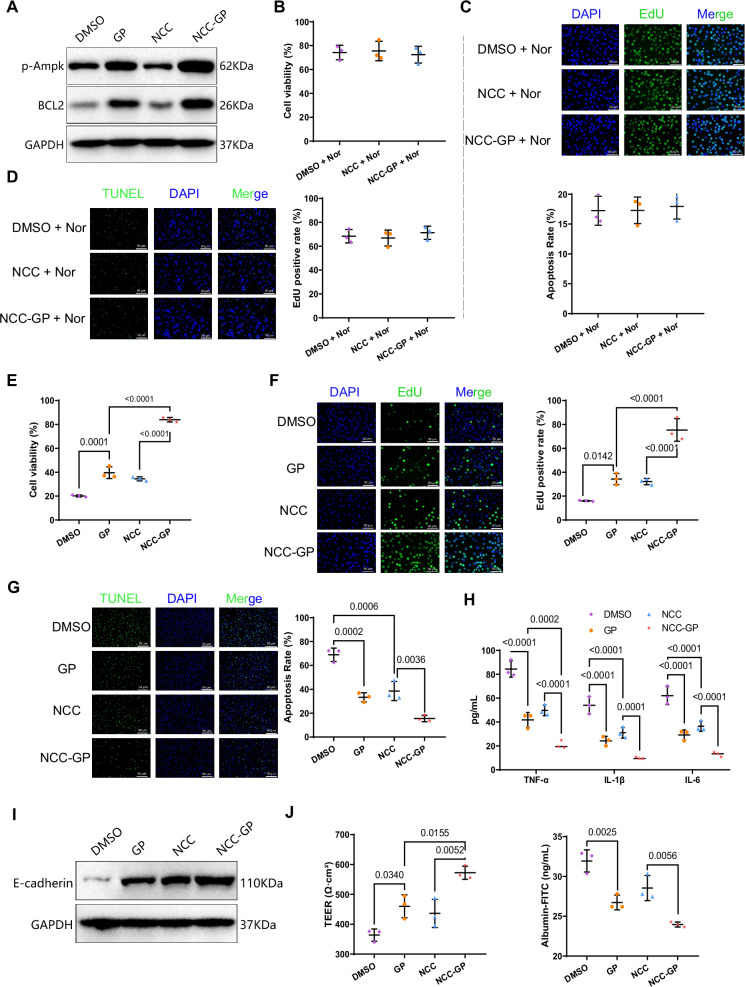
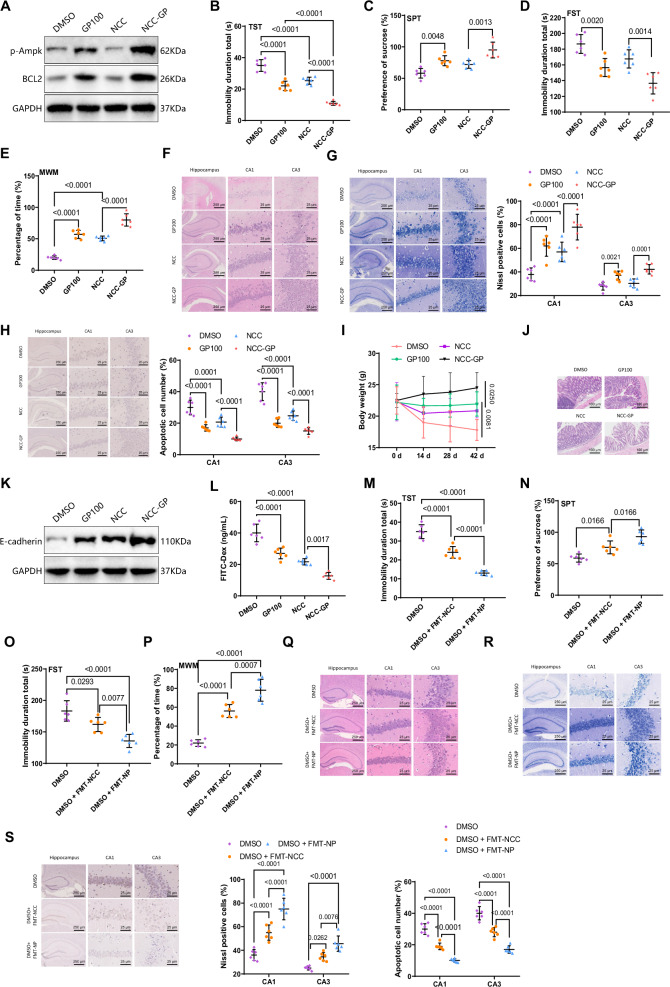
Depression, a major global health issue, is closely associated with imbalances in gut microbiota and altered intestinal functions. This study investigates the antidepressant potential of a composite of Geniposide (GP) and Nanocrystalline Cellulose (NCC), focusing on its effects on the gut-brain axis. Utilizing network pharmacology, GP was identified as a key compound targeting the BCL2 gene in depression management. Experimental approaches, including a chronic unpredictable mild stress (CUMS) model in mice, cellular assays, and fecal microbiota transplantation (FMT), were used to evaluate the composite's effectiveness. Results indicate that GP activates the adenosine monophosphate-activated protein kinase (AMPK) pathway by upregulating BCL2, enhancing intestinal barrier integrity, and balancing gut flora. These mechanisms contribute to its positive effects on hippocampal function and depressive-like behaviors in mice, suggesting that the GP-NCC composite could be a promising avenue for developing depression therapies that target gut health.


Conflict of interest statement

Competing interests: The author declares no competing interests. Ethical approval: All animal experiments were approved by the Animal Ethics Committee of Shenzhen Luohu District Hospital of Traditional Chinese Medicine (No. 2023-LHQZYYYXLL-KY-111).

Figures

Fig. 1
Fig. 1. Potential target screening and functional enrichment analysis of Gardenia jasminoides J. Ellis components for treating depression.
A Illustrative Overview of the Bioinformatics Analysis Process; B Venn Diagram Showing the Intersection Genes between Depression-Related Genes and Gardenia jasminoides J. Ellis Active Compound Target Genes; C Network Illustrating the Drug-Active Component-Target-Depression Relationship of Gardenia jasminoides J. Ellis, where green and red colors denote Gardenia jasminoides J. Ellis and Depression, respectively, yellow signifies 52 active compounds with target genes, and blue represents 47 intersecting target genes; D Hierarchical Tree Map displaying the enrichment of target genes in different GO categories (Biological Process, Cellular Component, Molecular Function); E Network Diagram of KEGG Pathway Enrichment Analysis; F Protein Interaction Node Statistics Chart of the 47 intersecting target genes; G PPI Network Graph based on the Degree value of the 47 intersecting target genes, wherein larger nodes with redder color indicate higher importance in the network, and thicker, redder lines denote stronger interaction relationships.
Fig. 2
Fig. 2. Validation of the therapeutic effect of GP on Depression.
A Overview of Mouse Depressive-Like Behavior Detection (Created by BioRender); BE Evaluation of depressive-like behavior in mice by TST, SPT, FST, and MWM experiments; F H&E staining results of the hippocampal tissues of mice in various groups, Scale bar=250 / 25 μm for the leftmost column, and Scale bar=25 μm for the remaining two columns; G Assessment of neuron cell counts in the hippocampal tissues of mice across different groups by Nissl staining, Scale bar=250 / 25 μm; H TUNEL staining to detect neuron cell apoptosis in the hippocampal tissues of mice in different groups, Scale bar=250/ 25 μm; One-way ANOVA was used for comparisons among different groups; I Immunohistochemical analysis of GFAP and BDNF expression in hippocampal tissues, Scale bar=50μm; J Weight changes in mice from each group; K ELISA analysis of inflammatory factor content in colonic tissues of mice in each group; L Immunohistochemical evaluation of E-cadherin content in colonic tissues of mice in various groups, Scale bar=100 μm; M H&E staining results of colonic tissues of mice in different groups, Scale bar=100 μm; NQ Assessment of depressive-like behavior in mice by TST, SPT, FST, and MWM experiments. For the comparison of two sets of data, the independent samples t-test was utilized, whereas for the comparison of data among multiple groups, ANOVA was employed. To compare data across different time points within each group, two-way ANOVA was conducted. The line between groups represents the specific p-value, with p < 0.05 indicating a statistically significant difference between groups, with 6 mice in each group.
Fig. 3
Fig. 3. Machine learning algorithm and proteomics combined identification of key targets for GP treatment in depression.
A Proportion of differentially expressed proteins (DEPs) between colonic tissues of three DMSO group mice and three GP100 group mice. B Comparison of the number of upregulated and downregulated DEPs, with red representing upregulated proteins and blue representing downregulated proteins, N = 6. C Heatmap showing the differential expression of the top 20 DEPs in the proteomics data, with DMSO (N = 3) and GP100 (N = 3) representing colonic tissue samples from three mice in each group. D Volcano plot of differentially expressed mRNA between colonic tissues of three DMSO group mice and three GP100 group mice in high-throughput sequencing data. E Heatmap showing the differential expression of selected DEGs in the high-throughput sequencing data, with DMSO (N = 3) and GP100 (N = 3) representing colonic tissue samples from three mice in each group. FG Lasso coefficient screening plot. H Random forest algorithm result plot. I SVM-RFE algorithm result plot. J Venn diagram showing the overlap of Depression-related mRNA and DEPs identified by three machine learning algorithms: lasso regression, random forest, and SVM-RFE. K Schematic workflow of bioinformatics analysis in Fig. 3 (Created by BioRender). L Molecular docking result between GP molecule and target protein BCL2. M RT-qPCR analysis of BCL2 expression changes in colonic tissues of mice after GP treatment, analyzed by independent t-test (N = 6 mice per group). In the volcano plot, blue dots represent significantly downregulated mRNA in the GP100 group, red dots represent significantly upregulated mRNA in the GP100 group, and gray dots represent mRNA with no significant difference. The line between groups represents the specific p-value, with p < 0.05 indicating a statistically significant difference between groups.
Fig. 4
Fig. 4. GP-mediated BCL2 expression alleviates depression.
A Schematic diagram of in vitro cell model; B Determination of inflammatory factor levels in cells of each group using ELISA; C Results of in vitro intestinal barrier integrity in different cell groups. The left graph shows TEER values representing cell barrier integrity, and the right graph shows FITC-Dex values representing cell barrier permeability; D Schematic diagram of cell experiment process (Created by BioRender); E Measurement of cell viability in each group using MTT assay; F Evaluation of cell proliferation capacity in each group using EdU assay (Scale bar=50 μm); G Re-assessment of inflammatory factor levels in cells of each group using ELISA; H Detection of E-cadherin expression in cells of each group using Western blot; I Same as (C), depicting the results of in vitro intestinal barrier integrity in different cell groups; J Assessment of cell viability in each group using MTT assay; K Evaluation of cell proliferation capacity in each group using EdU assay (Scale bar=50 μm); L Reinforced assessment of inflammatory factor levels in cells of each group using ELISA; M Re-examination of E-cadherin expression in cells of each group using Western blot; N Reiteration of in vitro intestinal barrier integrity results in different cell groups, with TEER values indicating cell barrier integrity on the left and FITC-Dex values representing cell barrier permeability on the right. Comparisons between two groups were analyzed using t-tests, while one-way ANOVA was used for comparisons among different groups. The line between groups represents the specific p-value, with p < 0.05 indicating a statistically significant difference between groups. Each cell experiment was replicated three times.
Fig. 5
Fig. 5. GP mediates BCL2 expression to activate the AMPK pathway, alleviating depression.
A Predicted results from the GeneMANIA database; B Evaluation of AMPK phosphorylation levels in cells of each group using Western blot; C Detection of BCL2 expression levels and AMPK phosphorylation levels in cells of each group through Western blot; D Assessment of cell viability in each group with MTT assay; E Examination of cell proliferation capacity in each group using EdU experiment (Scale bar=50 μm); F Measurement of inflammatory factor levels in cells of each group with ELISA; G Assessment of E-cadherin expression in cells of each group, analyzed by Western blot; H Measurement of in vitro intestinal barrier integrity in cells of each group, where TEER values in the left graph represent cell barrier integrity, and FITC-Dex values in the right graph represent cell barrier permeability; I Presentation of H&E staining results of mouse hippocampal tissues in each group, Scale bar=250 / 25 μm; J Examination of the number of neuronal cells in mouse hippocampal tissues of each group through Nissl staining, Scale bar=250 / 25 μm; K Detection of neuronal cell apoptosis status in mouse hippocampal tissues of each group using TUNEL staining, Scale bar=250 / 25 μm; L Recording of the body weight changes in mice of each group; M Demonstration of H&E staining results of mouse colon tissues in each group, with Scale bar=100 μm; N Determination of in vivo barrier integrity experiment results; (O-R) Evaluation of depressive-like behaviors in mice of each group using TST, SPT, FST, and MWM experiments. One-way ANOVA was used for comparisons among different groups. The line between groups represents the specific p-value, with p < 0.05 indicating a statistically significant difference between groups. Cell experiments were repeated three times, with 6 mice in each group.
Fig. 6
Fig. 6. Synthesis and characterization of NCC-GP.
A Schematic representation of the preparation and physical characterization process of the NCC-GP composite (Created by BioRender); B Scanning electron microscope images of the NCC-GP composite (Scale bar=500 nm); C Determination of the binding efficiency of NCC with GP using UV-Vis spectrophotometry; D Assessment of the Zeta potential of NCC-GP solution by dynamic light scattering (DLS); E Evaluation of the drug release rate of NCC-GP composite using UV-Vis spectrophotometry; F Investigation of intracellular uptake of fluorescently labeled NCC-GP after cellular internalization (Scale bar=50 μm). Cell experiments were repeated thrice.
Fig. 7
Fig. 7. Effects of NCC-GP on colonic epithelial cells.
A Evaluation of BCL2 expression levels and AMPK phosphorylation levels in cells of each group using Western blot; B Assessment of cell viability in each group with MTT assay; C Measurement of cell proliferation capacity in each group through EdU experiment (Scale bar=50 μm); D Evaluation of cell apoptosis status in each group using TUNEL staining (Scale bar=50 μm); E Reassessing cell viability in each group with MTT assay; F Analysis of cell proliferation capacity in each group through EdU experiment (Scale bar=50 μm); G Determination of cell apoptosis status in each group using TUNEL staining (Scale bar=50 μm); H Measurement of inflammatory factor levels in cells of each group with ELISA; I Detection of E-cadherin expression in cells of each group through Western blot; J Assessment of in vitro intestinal barrier integrity in cells of each group, where TEER values in the left graph represent cell barrier integrity, and FITC-Dex values in the right graph represent cell barrier permeability. Comparisons between two groups were analyzed using t-tests, while one-way ANOVA was used for comparisons among different groups. The line between groups represents the specific p-value, with p < 0.05 indicating a statistically significant difference between groups. Each cell experiment was repeated three times.
Fig. 8
Fig. 8. In vivo validation of NCC-GP alleviating depression via the gut-brain axis.
A Expression levels of BCL2 and AMPK in each group of cells were detected using Western blot; BE Depressive-like behaviors of mice in each group were assessed through TST, SPT, FST, and MWM experiments; F display of H&E staining results of hippocampal tissues in each group of mice, Scale bar = 250 μm / 25 μm; G Neuronal cell count in the hippocampal tissues of each group of mice was evaluated through Nissl staining, Scale bar = 250 / 25 μm; H Apoptosis of neuronal cells in the hippocampal tissues of each group of mice was examined using TUNEL staining, Scale bar = 250 / 25 μm; I Monitoring of weight changes in each group of mice with analyzed using two-way ANOVA; J Presentation of H&E staining results of colonic tissues in each group of mice, Scale bar = 100 μm; K Content of E-cadherin in colonic tissues of each group of mice was detected through Western blot; L Display of in vivo barrier integrity experiment results; MP Assessment of depressive-like behaviors in each group of mice through TST, SPT, FST, and MWM experiments; Q H&E staining results of hippocampal tissues in each group of mice, Scale bar = 250/25 μm; R Neuronal cell count in the hippocampal tissues of each group of mice was evaluated via Nissl staining, Scale bar = 250 / 25 μm; S Evaluation of neuronal cell apoptosis in the hippocampal tissues of each group of mice using TUNEL staining, Scale bar = 250 / 25 μm. Comparisons between two groups were analyzed using t-tests, while one-way ANOVA was used for comparisons among different groups. The line between groups represents the specific p-value, with p < 0.05 indicating a statistically significant difference between groups, with 6 mice per group.

Similar articles

References

    1. Walker, J. G. et al. Associations of meaning of illness with psychosocial, clinical, and immunological characteristics in patients with Leptomeningeal metastasis. Compr. Psychoneuroendocrinology8, 100099 (2021). - PMC - PubMed
    1. Monroe, S. M. & Harkness, K. L. Major depression and its recurrences: life course matters. Annu Rev. Clin. Psychol.18, 329–357 (2022). - PubMed
    1. Cui, R. Editorial (Thematic selection: a systematic review of depression). CN13, 480–480 (2015). - PMC - PubMed
    1. Mohanannair, G. et al. Multi-domain prognostic models used in middle-aged adults without known cognitive impairment for predicting subsequent dementia. Cochrane Database Syst. Rev. 10.1002/14651858.cd014885.pub2 (2023). - PMC - PubMed
    1. Moncrieff, J., Cooper, R. E., Stockmann, T., Amendola, S., Hengartner, M. P. & Horowitz, M. A. The serotonin theory of depression: a systematic umbrella review of the evidence. Mol. Psychiatry28, 3243–3256 (2022). - PMC - PubMed

LinkOut - more resources