

SHRs, biomarkers for dysregulated stress response, predict prognosis in sepsis patients: a retrospective cohort study from MIMIC-IV database
- PMID: 40287613
- PMCID: PMC12034187
- DOI: 10.1186/s12879-025-11011-4
SHRs, biomarkers for dysregulated stress response, predict prognosis in sepsis patients: a retrospective cohort study from MIMIC-IV database
Abstract
Background: The dysregulated stress response is a key pathological mechanism underlying sepsis and is strongly associated with poor clinical outcomes. Stress hyperglycemia, a common manifestation of this response, may provide valuable prognostic information in sepsis patients. The stress hyperglycemia ratio (SHR) offers a more accurate reflection of the stress response and may be instrumental in assessing sepsis prognosis.
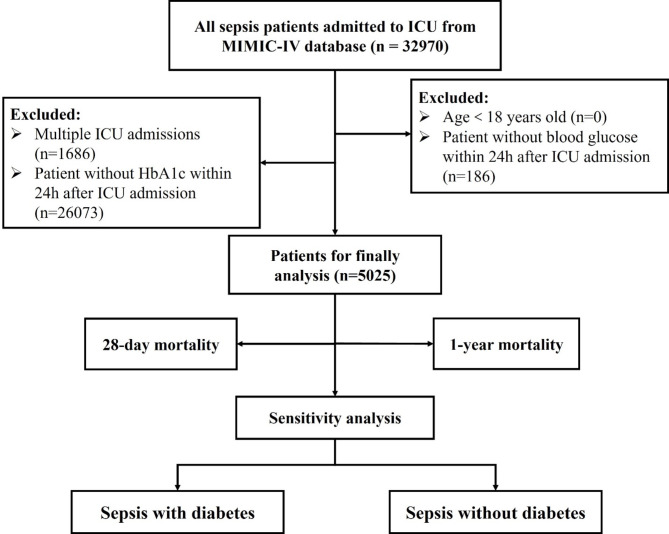
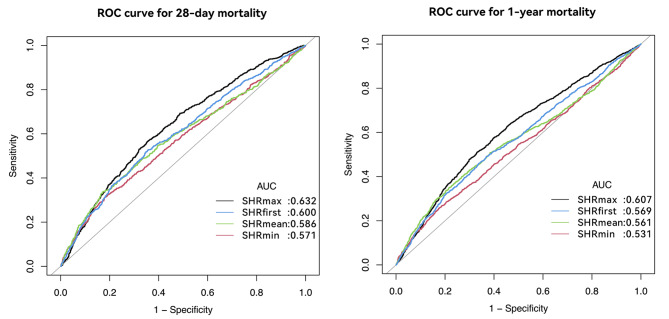
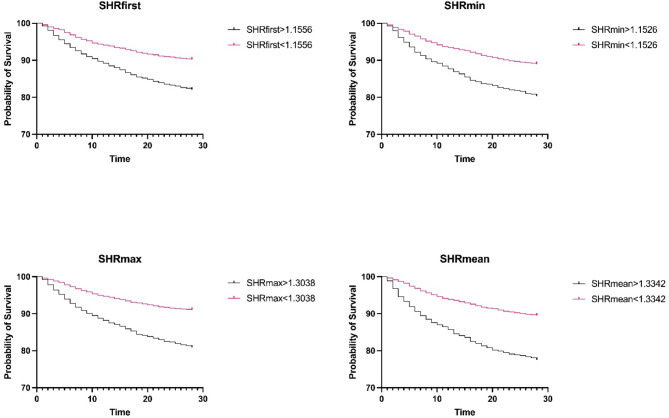
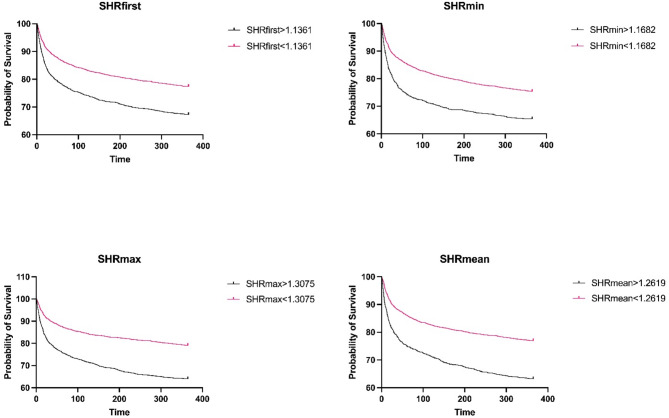
Methods: This study aimed to investigate the relationship between SHRs and clinical outcomes in sepsis patients. Data were obtained from the Medical Information Mart for Intensive Care IV database. Demographic information, intensive care unit (ICU) parameters within the first 24 h, laboratory results, insulin administration, survival time, and outcomes were extracted for analysis. Four SHR metrics (SHRfirst, SHRmin, SHRmax, and SHRmean) were calculated based on blood glucose values during the first 24 h of ICU admission (first, minimum, maximum, and mean, respectively). The predictive performance of each SHR metric was compared using the area under the receiver operating characteristic (ROC) curve. Kaplan-Meier survival analysis was performed to assess survival rates across groups defined by ROC curve-generated cut-off values. Associations between SHR and 28-day as well as 1-year mortality were further examined using both univariate and multivariate Cox regression analyses.
Results: A total of 5,025 sepsis patients were included, of whom 656 died within 28 days of ICU admission. SHR was significantly higher in the non-survivor group. Among the SHR metrics, SHRmax demonstrated the highest predictive value for both 28-day and 1-year mortality. Higher SHR values were consistently associated with increased mortality (all P < 0.001). For SHRmax, each 1-unit increase was associated with a 77% increase in mortality in univariate analysis and a 71.6% increase in multivariate analysis. Sensitivity analyses indicated that the relationship between SHR and mortality was stronger in patients without diabetes.
Conclusions: SHR serves as a robust marker of the dysregulated stress response in sepsis and holds significant prognostic value, particularly SHRmax, in predicting mortality. These findings underscore the potential clinical utility of SHR in guiding therapeutic strategies aimed at modulating the stress response and blood glucose levels in critically ill sepsis patients. Further research is warranted to explore SHR-targeted interventions in sepsis management.
Keywords: MIMIC-IV; Prognosis; SHR; Sepsis; Stress hyperglycemia ratio; Stress response.
© 2025. The Author(s).
Conflict of interest statement
Declarations. Ethics approval and consent to participate: Not applicable. Consent for publication: Not applicable. Competing interests: The authors declare no competing interests. Authors’ information: Not applicable. Financial disclosure statement: There are no financial conflicts of interest to disclose.
Figures
Similar articles
-
Joint association of the triglyceride-glucose index and stress hyperglycemia ratio with incidence and mortality risks of new-onset atrial fibrillation during sepsis: a retrospective cohort study.Cardiovasc Diabetol. 2025 Apr 2;24(1):149. doi: 10.1186/s12933-025-02709-5. Cardiovasc Diabetol. 2025. PMID: 40176089 Free PMC article.
-
Combined assessment of stress hyperglycemia ratio and glycemic variability to predict all-cause mortality in critically ill patients with atherosclerotic cardiovascular diseases across different glucose metabolic states: an observational cohort study with machine learning.Cardiovasc Diabetol. 2025 May 9;24(1):199. doi: 10.1186/s12933-025-02762-0. Cardiovasc Diabetol. 2025. PMID: 40346649 Free PMC article.
-
Association between stress hyperglycemia ratio index and all-cause mortality in critically ill patients with atrial fibrillation: a retrospective study using the MIMIC-IV database.Cardiovasc Diabetol. 2024 Oct 14;23(1):363. doi: 10.1186/s12933-024-02462-1. Cardiovasc Diabetol. 2024. PMID: 39402588 Free PMC article.
-
Predicting 28-day all-cause mortality in patients admitted to intensive care units with pre-existing chronic heart failure using the stress hyperglycemia ratio: a machine learning-driven retrospective cohort analysis.Cardiovasc Diabetol. 2025 Jan 8;24(1):10. doi: 10.1186/s12933-025-02577-z. Cardiovasc Diabetol. 2025. PMID: 39780223 Free PMC article.
-
Relationship between stress hyperglycaemic ratio (SHR) and critical illness: a systematic review.Cardiovasc Diabetol. 2025 May 2;24(1):188. doi: 10.1186/s12933-025-02751-3. Cardiovasc Diabetol. 2025. PMID: 40317019 Free PMC article.
References
-
- Arina P, Singer M. Pathophysiology of sepsis. Curr Opin Anaesthesiol. 2021;34(2):77–84. - PubMed
MeSH terms
Substances
Grants and funding
LinkOut - more resources
Full Text Sources
Medical
