

Dietary misreporting: a comparative study of recalls vs energy expenditure and energy intake by doubly-labeled water in older adults with overweight or obesity
- PMID: 40287632
- PMCID: PMC12034172
- DOI: 10.1186/s12874-025-02568-4
Dietary misreporting: a comparative study of recalls vs energy expenditure and energy intake by doubly-labeled water in older adults with overweight or obesity
Abstract
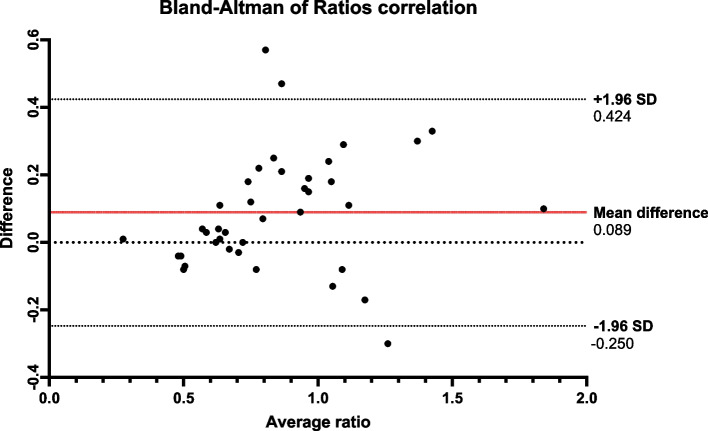
Background: Self-report methods are widely used to assess energy intake but are prone to measurement errors. We aimed to identify under-reported, over-reported, and plausible self-reported energy intake by dietary recalls (rEI) using a standard method (Method 1) that calculates the rEI ratio against measured energy expenditure (mEE) by doubly-labeled water (DLW), and compare it to a novel method (Method 2), which calculates the rEI ratio against measured energy intake (mEI) by the principle of energy balance (EB = mEE + changes in energy stores).
Methods: The rEI:mEE and rEI:mEI ratios were assessed for each subject. Group cut-offs were calculated for both methods, using the coefficient of variations of rEI, mEE, and mEI. Entries within ± 1SD of the cutoffs were categorized as plausible, < 1SD as under-reported, and > 1SD as over-reported. Kappa statistics was calculated to assess the agreement between both methods. Percentage bias (bβ) was estimated by linear regression. Remaining bias (dβ) was calculated after applying each method cutoffs.
Results: The percentage of under-reporting was 50% using both methods. Using Method 1, 40.3% of recalls were categorized as plausible, and 10.2% as over-reported. With Method 2, 26.3% and 23.7% recalls were plausible and over-reported, respectively. There was a significant positive relationship between mEI with weight (ß = 21.7, p < 0.01) and BMI (ß = 48.8, p = 0.04), but not between rEI with weight (ß = 13.1, p = 0.06) and BMI (ß = 41.8, p = 0.11). The rEI relationships were significant when only plausible entries were included using Method 1 (weight: ß = 17.4, p < 0.01, remaining bias = 49.5%; BMI: ß = 44.6, p = 0.01, remaining bias = 60.2%) and Method 2 (weight: ß = 19.5, p < 0.01, remaining bias = 24.9%; BMI: ß = 44.8, p = 0.03, remaining bias = 56.9%).
Conclusions: The choice of method significantly impacts plausible and over-reported classification, with the novel method identifying more over-reported entries. While rEI showed no relationships with anthropometric measurements, applying both methods reduced bias. The novel method showed greater bias reduction, suggesting that it may have superior performance when identifying plausible rEI.
Clinical trials registration: NCT04465721.
Keywords: Bias; Dietary misreporting; Dietary recall; Doubly labeled water; Energy intake; Goldberg cutoff; Nutrition assessment; Self-report.
© 2025. The Author(s).
Conflict of interest statement
Declarations. Ethics approval and consent to participate: This study was conducted according to the guidelines of the Declaration of Helsinki. Study was approved by the Columbia University Institutional Review Board (AAAS7791) and informed consent was obtained from all participants. Consent for publication: Not applicable. Competing interests: The authors declare no competing interests.
Figures


References
-
- Kirkpatrick SI, Troiano RP, Barrett B, Cunningham C, Subar AF, Park Y, et al. Measurement Error Affecting Web- and Paper-Based Dietary Assessment Instruments: Insights From the Multi-Cohort Eating and Activity Study for Understanding Reporting Error. Am J Epidemiol. 2022;191(6):1125–39. - DOI - PMC - PubMed
-
- Lafay L, Mennen L, Basdevant A, Charles MA, Borys JM, Eschwège E, et al. Does energy intake underreporting involve all kinds of food or only specific food items? Results from the Fleurbaix Laventie Ville Santé (FLVS) study. International journal of obesity and related metabolic disorders : journal of the International Association for the Study of Obesity. 2000;24(11):1500–6. - DOI - PubMed
Publication types
MeSH terms
Substances
Associated data
Grants and funding
LinkOut - more resources
Full Text Sources
Medical
