. 2025 Apr 26;24(1):184.
doi: 10.1186/s12933-025-02743-3.

Cardiomyocyte-specific NHE1 overexpression confers protection against myocardial infarction during hyperglycemia

Affiliations

Cardiomyocyte-specific NHE1 overexpression confers protection against myocardial infarction during hyperglycemia

Kai Jiang et al. Cardiovasc Diabetol. .

Abstract

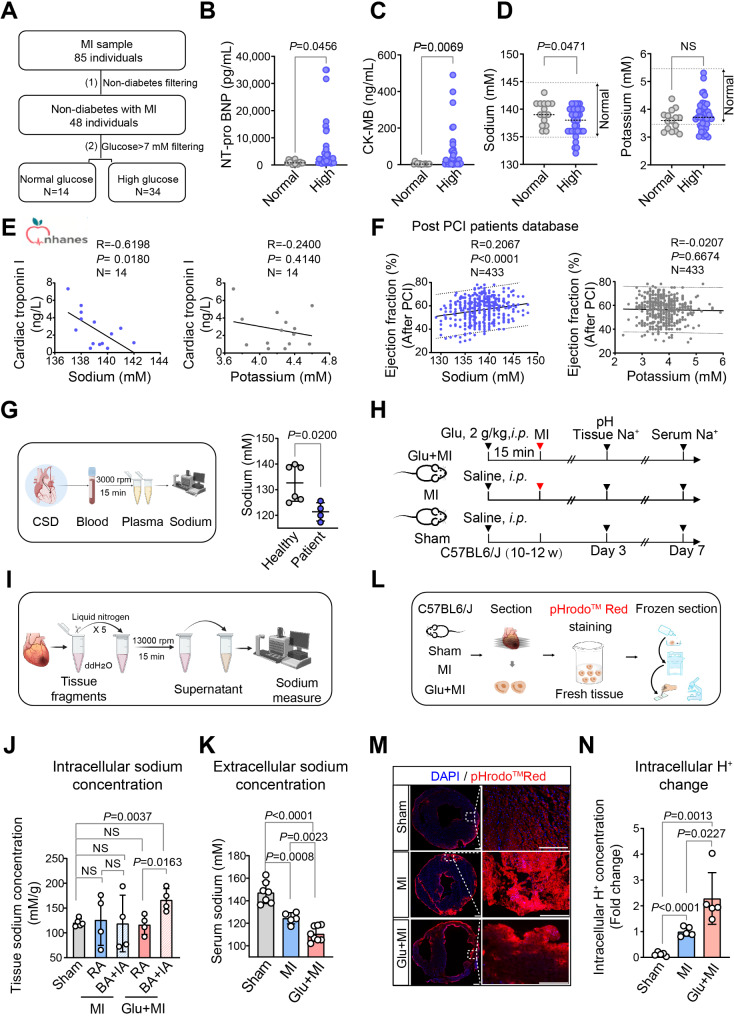
Background: Acute hyperglycemia on admission is frequently observed during the early phase after acute myocardial infarction (MI), even without the history of diabetes mellitus. We previously reported that inhibiting Na+/H+ exchanger 1 (NHE1) activity post-MI may improve outcomes, but not in the setting of MI with acute hyperglycemia. However, the precise role of NHE1 in the pathophysiology of MI with acute hyperglycemia remains to be elucidated, and there are no effective strategies for its prevention or treatment.

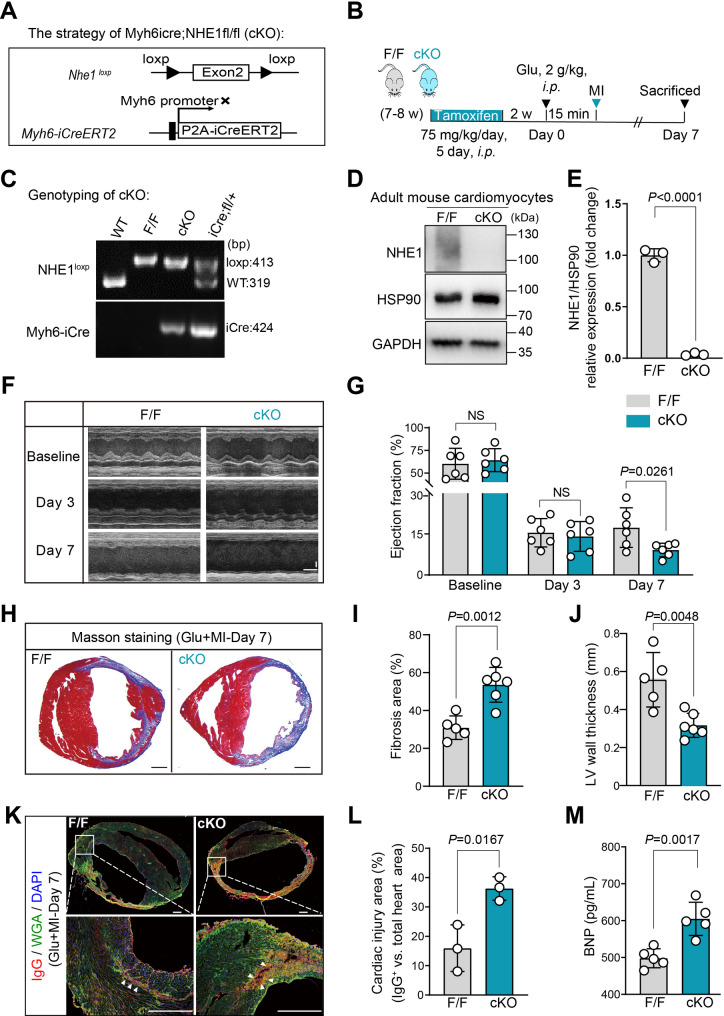
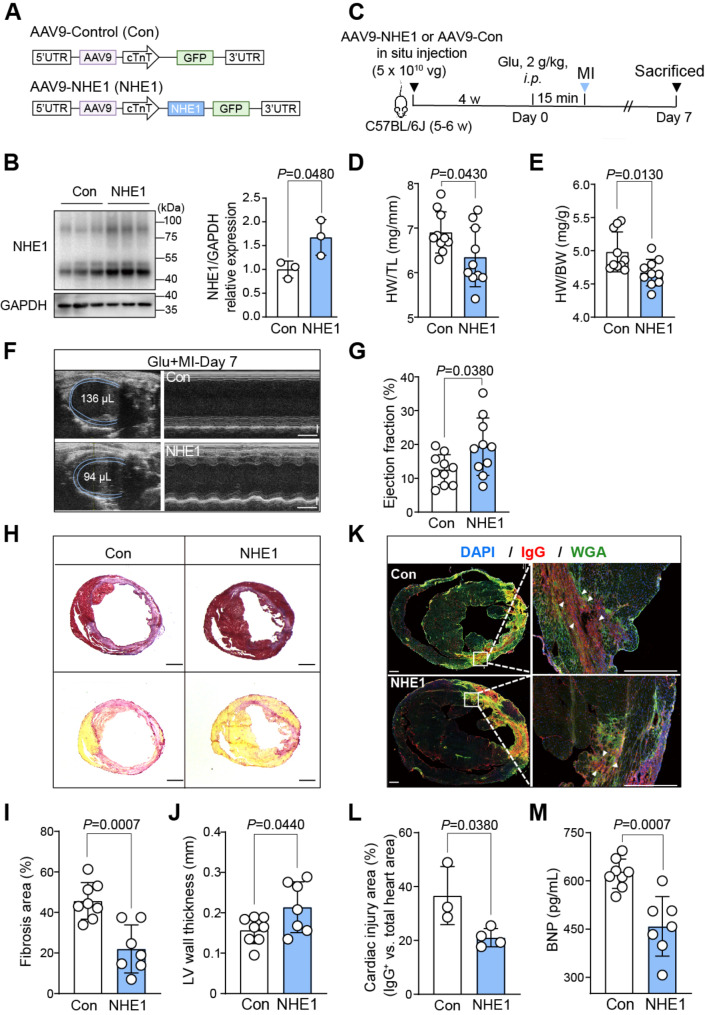
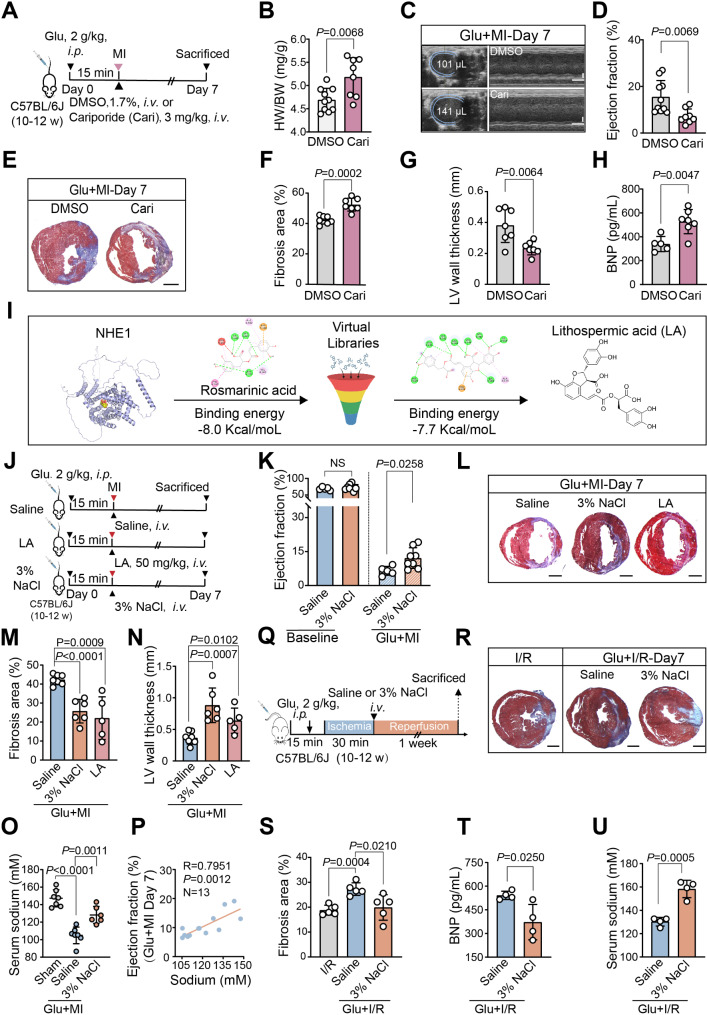
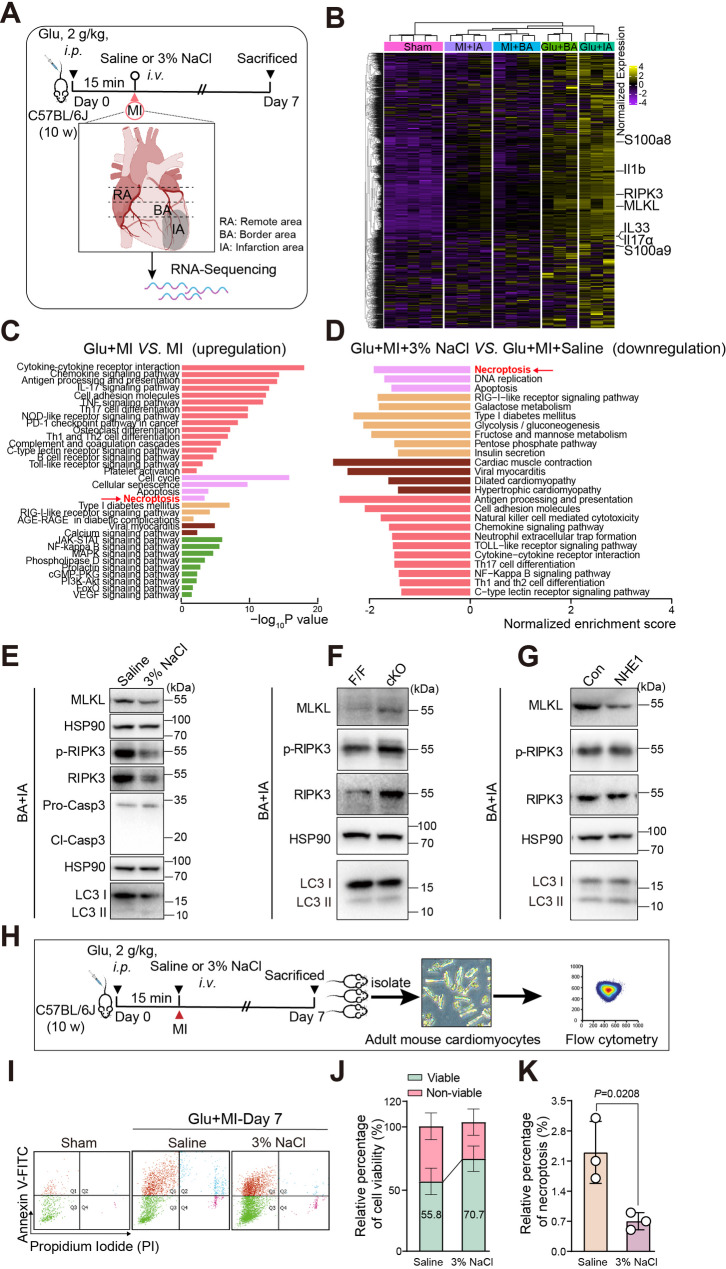
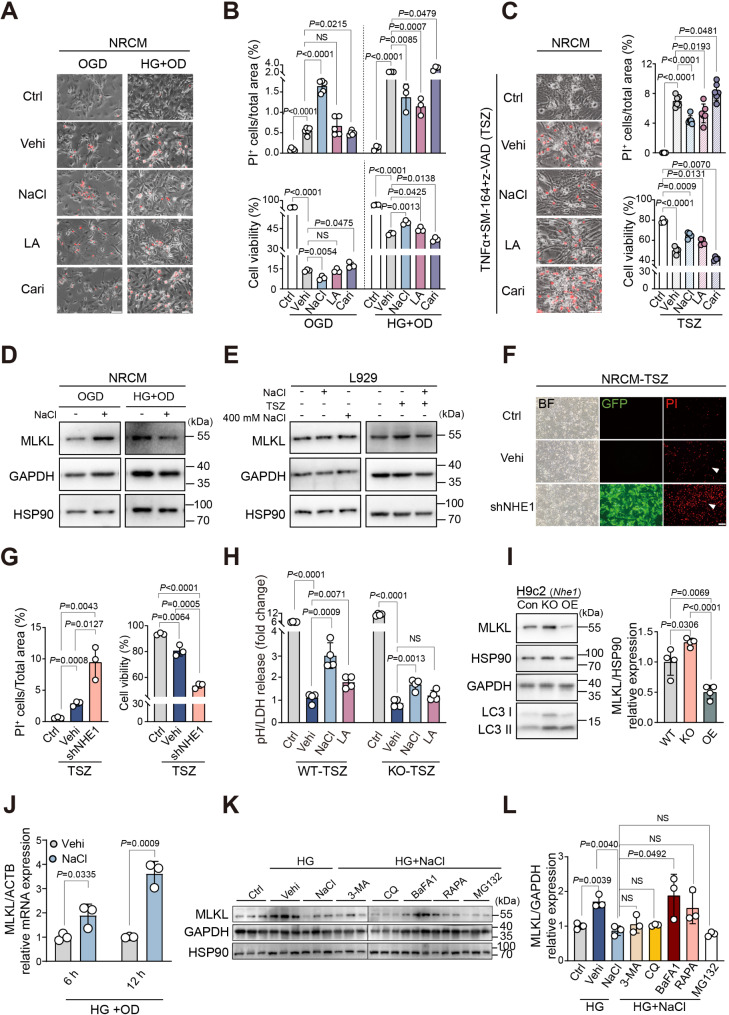
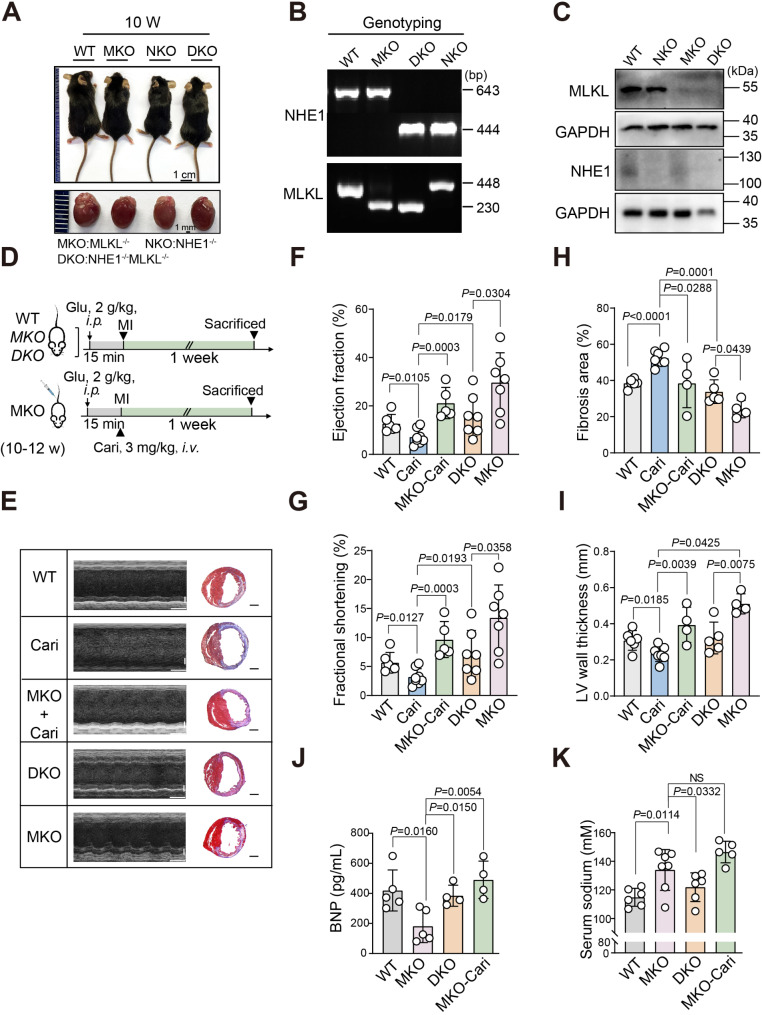
Methods and results: We analyzed 85 post-MI patients, identifying acute hyperglycemia (glucose > 7 mM) in non-diabetic individuals, linked to elevated BNP, CK-MB, and reduced plasma Na+. Using retrospective cohort studies and MI with acute hyperglycemia mouse models, we demonstrated that hyperglycemia exacerbates myocardial injury by reducing extracellular Na+, increasing intracellular Na+, and elevating pH, suggesting NHE1 activation as inferred from the observed intracellular pH (pHi) shift. Cardiomyocyte-specific NHE1 ablation or pharmacological inhibition worsened cardiac dysfunction and fibrosis in MI with acute hyperglycemia, while NHE1 overexpression conferred protection. RNA sequencing and drug screening identified accelerated NHE1 activation via 3% NaCl and lithospermic acid (LA) as a novel strategy to mitigate cardiomyocyte necroptosis, alleviating ischemic injury in MI and ischemia reperfusion models. Hypoxia-hyperglycemia and necroptosis induction models in NHE1-knockout, NHE1-overexpressing, and MLKL-overexpressing cardiomyocytes revealed that NHE1 activation, unlike its protective role in oxygen-glucose deprivation, promotes MLKL degradation via autophagosome-lysosomal pathways, reducing cardiomyocyte death. MLKL knockout and MLKL-NHE1 double knockout mice confirmed that MLKL ablation counteracts NHE1 inhibition's detrimental effects.

Conclusions: Activation of myocardial NHE1 promotes MLKL autophagic degradation, mitigating cardiomyocyte necroptosis and acute hyperglycemia-exacerbated MI, highlighting NHE1 as a hyperglycemia-dependent cardioprotective target. Moderate NHE1 activation may represent a novel therapeutic strategy for MI with acute hyperglycemia.


Conflict of interest statement

Declarations. Competing interests: The authors declare no competing interests.

Figures

Fig. 1
Fig. 1
Acute hyperglycemia induced Na+/H+ imbalances are associated with impaired cardiac function post MI. A Graphical overview of human study. BD Analysis of plasma N-terminal pro‐B‐type natriuretic peptide (NT-proBNP) and Creatine Kinase-MB (CK-MB) levels, serum sodium (Na+) and potassium (K+) concentrations between MI patients with normal glucose (n = 14) and those with high glucose (n = 34). E Correlation of serum levels of Na+ and K+ with the Cardiac troponin I (cTnI) in non-diabetic MI patients with admission blood glucose exceeding 7 mM (n = 14), collected from the NHANES database. F Correlation of plasma levels of Na+ and K+ with the EF in patients (non-diabetic patients with admission blood glucose exceeding 7 mM) post PCI (n = 433). G Schematic illustration showing the comparison of plasma Na⁺ concentrations from cardiac regions between healthy individuals (n = 6) and PCI patients (n = 4). CSD, coronary sinus ostium (proximal segment). H Schematic illustration of the modeling strategies for mouse Sham, MI, and Glu + MI groups. I Diagram of intracellular Na+ enrichment in mouse heart tissue. J Total intracellular Na+ levels in heart tissue isolated from Sham, MI or Glu + MI, normalized by tissue weight, n = 4 (MI, Glu + MI), n = 5 (Sham). RA: remote area; BA + IA: border and infarct area. K Analysis of serum Na⁺ concentrations in Sham, MI, and Glu + MI groups, n = 7 (Sham), 5 (MI) and 8 (Glu + MI). L Flowchart of intracellular H⁺ measurement in cardiac tissue. M–N Representative immunofluorescence M and quantification N of pHrodo™ Red (pHi) levels in heart tissue from Sham, MI and Glu + MI, n = 5 per group, scale bar 100 μm. Statistical significance in B, D and G was determined by two-tailed unpaired student’s-test, in C was by Mann–Whitney U test, while J, K and N were assessed using one-way ANOVA with Tukey’s test. Correlations in E and F were analyzed using Pearson’s correlation coefficient and simple linear regression analyses. All quantitative data are expressed as mean ± SD. NS, not significant
Fig. 2
Fig. 2
Cardiomyocyte-specific deficiency of NHE1 exacerbates cardiac injury in MI with acute hyperglycemia. A Schematic showing the strategy for generating cardiomyocyte-specific knockout mice (Myh6iCreNhe1fl/fl, cKO; Nhe1fl/fl, F/F). B Schematic representation of tamoxifen-induced NHE1 knockout in mouse cardiomyocytes with MI under acute hyperglycemia (Glu-MI). C Genotyping of WT, F/F, cKO and iCre;Nhe1fl/+ by PCR using primer pairs specific to the Nhe1loxp (loxp, 413 bp, wt, 319bp) and Myh6-iCre (iCre, 424 bp). D and E Western blot analysis and quantification of NHE1 protein levels in adult mouse cardiomyocytes (AMCM) from F/F and cKO mice, n = 3 per group. F Representative M-mode echocardiographic images of heart ultrasound recordings at baseline and on day 3 or 7 post MI with acute hyperglycemia (scale bar, 100 ms and 1 mm) of F/F and cKO mice. G Comparison of EF at baseline, day 3 and day 7 post MI with acute hyperglycemia in F/F and cKO mice (n = 6 for each group). H Representative Masson's trichrome staining in F/F and cKO mice at day 7 post MI with acute hyperglycemia, scale bar, 1 mm. I and J Quantification of cardiac fibrosis in total tissue area and LV wall thickness in F/F and cKO mice, n = 5 (F/F) and n = 6 (cKO). K and L Images and quantitative results of cardiac IgG immunostaining (red signals showing cardiac injury) in mouse hearts and the whole heart sections were stained with WGA (n = 3 per group). Scale bar, 500 μm. M Analysis of serum brain natriuretic peptide (BNP) levels between F/F and cKO mice at 7 day post-MI with acute hyperglycemia (n = 5 per group). P values correspond to one-way ANOVA with Tukey’s multiple comparisons test for G and two-tailed unpaired student’s t test was performed for E, I, J, L and M. All quantitative data are expressed as mean ± SD
Fig. 3
Fig. 3
Cardiomyocyte-specific overexpression of NHE1 alleviates cardiac damage caused by MI with acute hyperglycemia. A Schematic showing the strategy for cardiomyocyte-specific NHE1 overexpression (AAV9-Control, Con; AAV9-NHE1, NHE1) B Western blot analysis and quantification of NHE1 protein levels in extracts from heart samples of Con and NHE1 mice without MI with acute hyperglycemia (n = 3 for each group). C Schematic showing the experimental design for Con and NHE1 mice during MI with acute hyperglycemia. D and E The ratios of heart weight to body weight (HW/BW) and heart weight to tibia length (HW/TL) in Con and NHE1 mice (n = 10 per group). F Representative M-mode echocardiographic images of heart ultrasound recording at baseline and day 7 post MI with acute hyperglycemia (scale bar, 100 ms and 1 mm) for Con and NHE1 mice. G Comparison of EF at day 7 post MI with acute hyperglycemia in Con and NHE1 mice (n = 10 per group). H Representative Masson's trichrome staining (up) and Picrosirius red staining (down) in Con and NHE1 mice at day 7 post MI with acute hyperglycemia, scale bar, 1 mm. I and J Quantification of cardiac fibrosis in total tissue area and LV wall thickness in Con and NHE1 mice, n = 8 (Con) and n = 7 (NHE1). K and L Images and quantitative results of cardiac IgG immunostaining (red signals) in mouse hearts, whole heart sections were stained with WGA, n = 3 (Con) and n = 4 (NHE1). Scale bar, 500 μm. M Analysis of serum BNP levels between Con and NHE1 mice at 7 day post-MI with acute hyperglycemia, n = 8 (Con) and n = 7 (NHE1). Statistical significance in B, C, D, E, G, I, J, L and M were determined using two-tailed unpaired student’s t test. All quantitative data are expressed as mean ± SD
Fig. 4
Fig. 4
Administration of NHE1 activators, instead of inhibitors, resists pathological cardiac damage in mice during MI with acute hyperglycemia. A Schematic diagram showing the strategy for administering vehicle (DMSO) and NHE1 inhibitor (cariporide, Cari) to the mice. B The ratios of heart weight to body weight (HW/BW) in DMSO and Cari mice post 7 days MI with acute hyperglycemia, n = 10 (DMSO) and n = 8 (Cari). C and D High-frequency ultrasound echocardiography (HFUS) at day 7 after MI with acute hyperglycemia and the quantification of left ventricular ejection fraction (LVEF), n = 10 (DMSO) and n = 8 (Cari). E–G Representative Masson's trichrome staining and quantification of cardiac fibrosis in total heart area and LV wall thickness in DMSO and Cari mice at day 7 post MI with acute hyperglycemia, n = 7 per group, scale bar, 1 mm. H Analysis of serum BNP levels between DMSO and Cari mice at day 7 post-MI with acute hyperglycemia, n = 5 (DMSO) and n = 7 (Cari). I The experimental scheme of high-throughput screening of the activators of NHE1. J Schematic diagram showing the strategy for administering vehicle (Saline, 0.9% NaCl), LA and 3% NaCl to the mice. K Comparison of EF at baseline and day 7 post MI with acute hyperglycemia in Saline and 3% NaCl mice, n = 5 (Saline) and n = 8 (3% NaCl). L–N Representative Masson’s trichrome staining and quantification of cardiac fibrosis in total heart section area and LV wall thickness in Saline (n = 7), LA (n = 5) and 3% NaCl (n = 6) mice at day 7 post MI with acute hyperglycemia, scale bar, 1 mm. O Serum sodium concentrations from the Sham (n = 7), Saline (n = 7) and 3% NaCl (n = 6) post 7 day MI with acute hyperglycemia. P Correlation of serum sodium concentrations with EF post 7 day of MI with acute hyperglycemia (n = 13). Q Schematic diagram showing the strategy for I/R, Glu + I/R + vehicle (Saline) and Glu + I/R + 3% NaCl (3% NaCl) administration to the mice during I/R. R and S Representative Masson’s trichrome staining and quantification of cardiac fibrosis in Saline and 3% NaCl mice at day 7 post-reperfusion following 30 min of ischemia, with or without 15 min of acute hyperglycemia, n = 5 per group, scale bar, 1 mm. T and U Analysis of serum BNP levels and serum sodium concentrations from the Saline and 3% NaCl groups post 7 days reperfusion with acute hyperglycemia, n = 4 per group. Statistical significance in B, D, F, G, H and T, U were determined by two-tailed unpaired student’s t-test, while in K, M, N, O and S were determined by one-way ANOVA with Tukey’s test. The correlation in P was analyzed by Pearson's correlation coefficient and simple linear regression analyses. All quantitative data are expressed as mean ± SD. NS, not significant
Fig. 5
Fig. 5
NHE1 activator ameliorates heart injury by attenuating necroptosis. A Schematic illustration of heart tissue samples for RNA-Seq. B Heatmap showing the gene expression levels of distinct heart regions across different conditions. C KEGG pathway enrichment analysis of genes in the expression pattern in B (upregulation in the comparison of Glu+MI vs. MI) via hyper-geometric distribution. D Down regulated pathways in the comparison of Glu+MI+3% NaCl vs. Glu+MI+Saline via GSEA. E–K Western blot analysis of MLKL, p-RIPK3, RIPK3, Caspase 3 and LC3 in the hearts of the border and infarct area in Glu+MI mice treated with Saline and 3% NaCl (E), F/F and cKO (F), Con and NHE1 (G), n = 3 (E, G) and n = 4 (F). H Schematic of in vitro isolated adult mouse cardiomyocytes harvested from mouse hearts at day 7 post MI with acute hyperglycemia, treated with Saline and 3% NaCl for flow cytometry analysis. I–K Flow cytometric analysis (I) and quantification of surviving cells (J) and necroptotic cells (K) in adult mouse cardiomyocytes (n = 3 per group). Statistical analysis was performed using two-tailed unpaired student’s t-test. Data are presented as mean ± SD
Fig. 6
Fig. 6
NHE1 promotes MLKL autophagic-degradation to confer cardioprotection. A Representative image of neonatal rat cardiomyocytes (NRCM) treated with vehicle (Vehi), NaCl (100 mM), LA (25 μM) and Cari (10 μM) during high glucose (35 mM)-oxygen deprivation (HG+OD), oxygen–glucose deprivation (OGD) stimulation and visualized using propidium iodide (PI). Scale bars, 100 μm. B Quantification of PI-positive cells in the total cell area (top, n = 5 for OGD, n = 3 for HG + OD) and cell viability measured by LDH assay (bottom, n = 3 per group) in NRCM treated with vehi, LA, NaCl, and Cari under HG + OD (24 h) and OGD (12 h) conditions. C Representative image and quantitative analysis of PI-positive cells in the total cell area (n = 6) and cell viability (n = 4) in NRCM following treatment with vehi, LA (50 μM), NaCl (100 mM), and Cari (10 μM) under TSZ (TNF-α, 50 ng/mL; SM-164, 5 μM and z-VAD, 25 μM) for 3 h in NRCM. D Western blot analysis of MLKL in NRCM treated with Saline and 100 mM NaCl during OGD (left) and HG + OD (right). E Western blot analysis of MLKL in L929 cells treated with 100 mM and 400 mM NaCl (left) for 30 min or with 100 mM NaCl during TSZ (right) for 60 min. Blots are representative of three independent experiments. F and G Representative images and quantification of PI+ cells in the total cell area and cell viability of NRCM infected with Lenti-shNHE1 and treated with TSZ for 3 h, n = 3, scale bars, 100 μm. H The ratio of intracellular pH to LDH release levels was measured by BCECF-AM (3 μM) and CellTiter-Glo assay, n = 4 per group. I Western blot analysis of MLKL in NHE1 overexpression and knockout in the cardiomyocytes with stable constructs, blots are representative of four independent experiments. J Transcriptional levels of MLKL in NRCM subjected to HG + OD for 6 and 12 h were compared between the Saline and 100 mM NaCl treatment groups, n = 3 per group. K and L Western blotting and quantification of MLKL were performed in MLKL-overexpressing cardiomyocytes treated with vehicle, 100 mM NaCl and then treated with 3-Methyladenine (3-MA, 10 mM, 12 h), Chloroquine (CQ, 25 μM, 12 h), Bafilomycin A1 (BafA1, 100 nM, 12 h), Rapamycin (RAPA, 5 μM, 24 h) and MG132 (20 μM, 8 h). Blots are representative of three independent experiments. Statistical significance was determined by One-way ANOVA with Tukey’s test. All quantitative data are expressed as mean ± SD
Fig. 7
Fig. 7
MLKL knockout mitigates cardiac injury caused by NHE1 deficiency/inhibition in MI with acute hyperglycemia. A Gross morphology and heart size comparison of WT, MKO (MLKL−/−), NKO (NHE1−/−) and DKO (NHE1−/−MLKL−/−), scale bar 1 cm for mice and 1 mm for heart. B Genotyping of WT, MKO, NKO and DKO by PCR using primer pairs specific to the Nhe1 and Mlkl. C Western blot and quantification of NHE1 and MLKL protein levels in heart extracted from WT and DKO mice. D Schematic diagram showing the strategy of WT, Cari, MKO, DKO and MKO + Cari mice during MI with acute hyperglycemia. E Representative M-mode echocardiographic images (left) and Masson’s trichrome staining (right) of WT, Cari, MKO, DKO and MKO + Cari mice post 7 days of MI with acute hyperglycemia, scale bar, 100 ms and 1 mm for echocardiographic images and scale bar, 1 mm for Masson. F and G Comparison of EF and FS at day 7 post MI with acute hyperglycemia in WT (n = 5), Cari (n = 8), MKO (n = 7), DKO (n = 7) and MKO + Cari (n = 5) mice. H and I Quantification of cardiac fibrosis of total heart section area and LV wall thickness in WT (n = 6), Cari (n = 7), MKO (n = 4), DKO (n = 5) and MKO + Cari (n = 4) mice. J Analysis of serum BNP level between WT (n = 5), MKO (n = 5), DKO (n = 4) and MKO + Cari (n = 4) mice post 7 day MI with acute hyperglycemia. K Analysis of serum Na+ concentrations from the WT (n = 6), MKO (n = 7), DKO (n = 6) and MKO + Cari (n = 5) post 7 day MI with acute hyperglycemia. Statistical significance was determined by One-way ANOVA with Tukey’s test. All quantitative data are expressed as mean ± SD

Similar articles

References

    1. Deedwania P, Kosiborod M, Barrett E, Ceriello A, Isley W, Mazzone T, Raskin P. Hyperglycemia and acute coronary syndrome: a scientific statement from the American heart association diabetes committee of the council on nutrition, physical activity, and metabolism. Circulation. 2008;117(12):1610–9. - PubMed
    1. Zarich SW, Nesto RW. Implications and treatment of acute hyperglycemia in the setting of acute myocardial infarction. Circulation. 2007;115(18):e436-439. - PubMed
    1. Sacks D, Baxter B, Campbell BCV, Carpenter JS, Cognard C, Dippel D, Eesa M, Fischer U, Hausegger K, Hirsch JA, et al. Multisociety consensus quality improvement revised consensus statement for endovascular therapy of acute ischemic stroke. Int J Stroke Off J Int Stroke Soc. 2018;13(6):612–32. - PubMed
    1. Yang J, Zheng Y, Li C, Gao J, Meng X, Zhang K, Wang W, Shao C, Tang YD. The impact of the stress hyperglycemia ratio on short-term and long-term poor prognosis in patients with acute coronary syndrome: insight from a large cohort study in Asia. Diabetes Care. 2022;45(4):947–56. - PubMed
    1. Upur H, Li JL, Zou XG, Hu YY, Yang HY, Abudoureyimu A, Abliz A, Abdukerim M, Huang M. Short and long-term prognosis of admission hyperglycemia in patients with and without diabetes after acute myocardial infarction: a retrospective cohort study. Cardiovasc Diabetol. 2022;21(1):114. - PMC - PubMed

MeSH terms