. 2025 May 6;64(9):2100-2115.
doi: 10.1021/acs.biochem.5c00029. Epub 2025 Apr 27.

Regulation of Genome Architecture in Huntington's Disease

Affiliations

Regulation of Genome Architecture in Huntington's Disease

Stephanie Portillo-Ledesma et al. Biochemistry. .

Abstract

Huntington's disease (HD) is a neurological condition caused by an excessive expansion of CAG repeats in the Huntingtin (HTT) gene. Although experiments have shown an altered epigenetic landscape and chromatin architecture upon HD development, the structural consequences on the HTT gene remain elusive. Structural data are only available for model nucleosome systems and yeast systems with human nucleosomes. Here, we use our experimentally validated nucleosome-resolution mesoscale chromatin model to investigate folding changes of the HTT gene associated with HD. We investigate how the histone fold domain of the variant macroH2A1, a biomarker of HD, affects the genome structure by modeling HD-like systems that contain (i) 100% canonical, (ii) 100% macroH2A1, (iii) 50% canonical and 50% macroH2A1, and (iv) 100% hybrid cores (one canonical H2A and one macroH2A1 per nucleosome). Then, we model the mouse HTT gene in healthy and HD conditions by incorporating the CAG expansion and macroH2A1 cores, reducing the linker histone density and tail acetylation levels, and incorporating genomic contacts. Overall, our results show that the histone fold domain of macroH2A1 affects chromatin compaction in a fiber-dependent manner (i.e., nucleosome distribution dependent) and can thus both enhance or repress HTT gene expression. Our modeling of the HTT gene shows that HTT is less compact in the diseased condition, which could accelerate the production of the mutated protein. By suggesting the structural biophysical consequences of the HTT gene under HD conditions, our findings may help in the development of diagnostic and therapeutic treatments for HD.


Conflict of interest statement

The authors declare no competing financial interest.

Figures

Figure 1
Figure 1
Chromatin mesoscale model and systems. Top left: Nucleosome resolution mesoscale model showing three nucleosomes connected by irregular linker DNA (red beads), details of histone tails (N-terminal tails of H2A, H2B, H3, and H4, and C-terminal tail of H2A (H2A2)) and linker histone (blue beads). Top right: 300 DiSCO charges for the canonical, macroH2A1, and hybrid cores. We also show the crystal structure of the nucleosome, indicating the position of each histone, where H2A is shown in yellow. Bottom: Systems studied, including the HD-like systems (Short NRL, Medium NRL, and Medium NRL + NFR, top) and the HTT gene (bottom). For the HTT gene, we show the distribution of linker DNA (Table S3) and the genomic contacts introduced by harmonic restraints between nucleosomes 1 and 357, 408, 442, and 519 in healthy conditions; and between nucleosome 1 and 531, 621, and 688 in the diseased conditions; as well as the acetylation regions covering nucleosomes 1–7 and 629–659, and LH density.
Figure 2
Figure 2
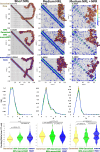
Effect of the macroH2A1 variant on chromatin fiber architecture. For each system, Short NRL, Medium NRL, and Medium NRL + NFR, with all-canonical (yellow), all-macroH2A1 (blue), or a combination of 50% canonical and 50% macroH2A1 (green) cores, we show the internucleosome contact maps calculated from an ensemble of 6000 structures with their corresponding density on the top left corner, representative chromatin configuration, randomly selected, on top of the contact maps with canonical cores yellow and macroH2A1 cores blue, internucleosome interaction plots in 1D, and violin plots for packing ratio, where black lines indicate the mean and red lines indicate the median. Statistical significance: Student’s t test.
Figure 3
Figure 3
Effect of the macroH2A1 variant on fiber local geometry. For each system, Short NRL, Medium NRL, and Medium NRL + NFR with all-canonical (yellow), all-macroH2A1 cores (blue), or a combination of 50% canonical and 50% macroH2A1 cores (green), we show the angle between the plane of two consecutive cores (core–core twisting), the distance between two consecutive cores (core–core distance), and the angle between three consecutive cores (core–core–core angle) calculated from an ensemble of 6000 structures. For each property, we illustrate at right what is calculated. Black lines in the violin indicate the mean and red lines indicate the median. Statistical significance: Student’s t test.
Figure 4
Figure 4
Effects of compaction and internucleosome interactions for systems with hybrid cores (one H2A monomer and one macroH2A1 monomer per core) compared to all-canonical or all-macroH2A1 cores. For each system: Short NRL, Medium NRL, and Medium NRL + NFR with all-canonical cores (yellow), all-hybrid cores (light blue), and all-macroH2A1 cores (blue), we show from top to bottom: violin plots for the packing ratio; violin plots for the sedimentation coefficient; internucleosome interaction plots in 1D and representative fiber configurations of systems with all hybrid cores (light blue). Statistical significance: Student’s t test.
Figure 5
Figure 5
Epigenetic landscape typical of HD favoring transcription of HTT. For the HTT gene system in healthy and diseased conditions, we show violin plots for the sedimentation coefficient and for the average number of nucleosomes per clutch and number of clutches computed from our models. For the average number of nucleosomes per clutch, we also report previous experimentally determined value at the genome-wide level (yellow star) and theoretically determined value at a single-locus level (blue square). Representative structures of the gene in each condition as computed by our models are illustrated, with LHs in cyan, wildtype tails in blue, and acetylated tails in read. Statistical significance: Student’s t test.
Figure 6
Figure 6
Epigenetic effects of HD on the type of internucleosme interactions in the HTT gene. For the HTT gene system in healthy and diseased conditions, we show at the top internucleosome interaction contacts as a function of the genomic position. We annotate peaks for short-range interactions (i ± 2, 3, 4, 5, 6) and structural motifs like zigzag topology, clutches, and hierarchical loops. At bottom, we show in two plots the number of contacts established in the HTT gene between acetylated regions (Ac/Ac, red), an acetylated region and LHs (Ac/LH, pink), two LH regions (LH/LH, cyan), nucleosome free regions and acetylated regions (NFR/Ac, green), nucleosome free regions and LHs (NFR/LH, blue), and between two regions that have no epigenetic marks (WT/WT, gray).

References

    1. MacDonald M. E.; Ambrose C. M.; Duyao M. P.; Myers R. H.; Lin C.; Srinidhi L.; Barnes G.; Taylor S. A.; James M.; Groot N.; MacFarlane H.; Jenkins B.; Anderson M. A.; Wexler N. S.; Gusella J. F. A novel gene containing a trinucleotide repeat that is expanded and unstable on Huntington’s disease chromosomes. Cell 1993, 72, 971–983. 10.1016/0092-8674(93)90585-E. - DOI - PubMed
    1. Ha A. D.; Jankovic J. Exploring the correlates of intermediate CAG repeats in Huntington disease. Postgraduate medicine 2011, 123, 116–121. 10.3810/pgm.2011.09.2466. - DOI - PubMed
    1. Schulte J.; Littleton J. T. The biological function of the Huntingtin protein and its relevance to Huntington’s Disease pathology. Curr. Trends Neurol. 2011, 5, 65–78. - PMC - PubMed
    1. Bassi S.; Tripathi T.; Monziani A.; Di Leva F.; Biagioli M. Epigenetics of huntington’s disease. Adv. Exp. Med. Biol. 2017, 978, 277–299. 10.1007/978-3-319-53889-1_15. - DOI - PubMed
    1. Francelle L.; Lotz C.; Outeiro T.; Brouillet E.; Merienne K. Contribution of neuroepigenetics to Huntington’s disease. Front. Hum. Neurosci. 2017, 11, 17.10.3389/fnhum.2017.00017. - DOI - PMC - PubMed

Publication types