. 2025 Apr;122(2):e70175.
doi: 10.1111/tpj.70175.

Conservation genomics of a threatened subtropical Rhododendron species highlights the distinct conservation actions required in marginal and admixed populations

Affiliations

Conservation genomics of a threatened subtropical Rhododendron species highlights the distinct conservation actions required in marginal and admixed populations

Yuhang Chang et al. Plant J. 2025 Apr.

Abstract

With the impact of climate change and anthropogenic activities, the underlying threats facing populations with different evolutionary histories and distributions, and the associated conservation strategies necessary to ensure their survival, may vary within a species. This is particularly true for marginal populations and/or those showing admixture. Here, we re-sequence genomes of 102 individuals from 21 locations for Rhododendron vialii, a threatened species distributed in the subtropical forests of southwestern China that has suffered from habitat fragmentation due to deforestation. Population structure results revealed that R. vialii can be divided into five genetic lineages using neutral single-nucleotide polymorphisms (SNPs), whereas selected SNPs divide the species into six lineages. This is due to the Guigu (GG) population, which is identified as admixed using neutral SNPs, but is assigned to a distinct genetic cluster using non-neutral loci. R. vialii has experienced multiple genetic bottlenecks, and different demographic histories have been suggested among populations. Ecological niche modeling combined with genomic offset analysis suggests that the marginal population (Northeast, NE) harboring the highest genetic diversity is likely to have the highest risk of maladaptation in the future. The marginal population therefore needs urgent ex situ conservation in areas where the influence of future climate change is predicted to be well buffered. Alternatively, the GG population may have the potential for local adaptation, and will need in situ conservation. The Puer population, which carries the heaviest genetic load, needs genetic rescue. Our findings highlight how population genomics, genomic offset analysis, and ecological niche modeling can be integrated to inform targeted conservation.

Keywords: Rhododendron; climate change; conservation management; demographic history; genomic offset; local adaptation.


Conflict of interest statement

The authors declare no competing interests.

Figures

Figure 1
Figure 1
The morphology characteristics, habitat and distribution of Rhododendron vialii. (a) The red, tubular, funnel‐shaped corolla of R. vialii. (b) R. vialii growing near terraced fields. (c) Habitat destruction caused by road construction. (d) Geographical distribution of the 21 sampling locations. The pie charts show the ancestral components with K = 5, from the results of the ADMIXTURE analysis based on Dataset 4. The province and country boundaries were drawn from the Chinese standard map GS (2019) 1822.
Figure 2
Figure 2
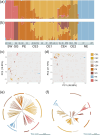
Population structure of Rhododendron vialii inferred based on the unlinked SNPs (Dataset 4) and the presumed adaptive SNPs (Dataset 5). (a) Genetic structure based on Dataset 4 with K = 5 from ADMIXTURE. (b) Genetic structure inferred from Dataset 5 using ADMIXTURE with K = 6. (c) PCA plot of the first two components based on Dataset 4. (d) Visualization of the first two principal components from Dataset 5. (e) NJ phylogenetic tree of 102 R. vialii individuals based on Dataset 4. (f) NJ phylogenetic tree constructed for 102 individuals of R. vialii using Dataset 5.
Figure 3
Figure 3
Inference of gene flow and population demography of Rhododendron vialii. (a) The maximum‐likelihood tree of the R. vialii populations constructed using Treemix, where the arrows indicate the direction of gene flow and the colors represent its intensity. (b) Population demography was inferred using a PSMC model of 13 deep sequenced individuals. The light‐colored lines represent the individuals assigned to different groups, with the bold line indicating the average effective population size. (c) Demographic history of all R. vialii individuals based on unfolded‐SFS performed using Stairway Plot 2. (d) Demographic history of all R. vialii individuals divided into three groups, inferred from the unfolded‐SFS using Stairway Plot 2. The 95% confidence interval (CI) for the estimated effective population size was displayed in light‐colored areas. The light blue stripes represent periods of the Naynayxungla Glaciation, the Guxiang Glaciation, and the Baiyu Glaciation, respectively.
Figure 4
Figure 4
Prediction of the potential suitable habitat for Rhododendron vialii in future periods under different climate scenarios. (a) Prediction of the potential suitable habitat under the SSP126 climate scenario for the period 2041–2060. (b) Prediction of the potential suitable habitat under the SSP585 climate scenario for the period 2041–2060. (c) Forecasting the potential suitable habitat under the SSP126 climate scenario during 2081–2100. (d) Forecasting the potential suitable habitat under the SSP585 climate scenario during 2081–2100. Red shading represents a suitable environment according to the ENM. Yellow stars represent the locations of specimens and surveys. Dots are the sampling locations from this study, and their colors are determined by the weighted‐mean RONA, which assigned a weight equivalent to the contribution of each variable in the ENM.
Figure 5
Figure 5
GF‐predicted genetic offset under the future climate scenarios from 2081 to 2100, based on the reference SNPs and the core environment adaptive variants. (a) Genetic offset under the SSP126 scenario based on reference SNPs. (b) Genetic offset analysis under the SSP585 scenario using reference SNPs. (c) Analysis of genetic offset under the SSP126 scenario using core environment adaptive variant SNPs. (d) Genetic offset evaluation under the SSP585 scenario through core environment adaptive variant SNPs. The color bar from blue to red signifies an increasing degree of offset, with dots marking the sampling locations of this study and stars denoting the locations of specimens and surveys.
Figure 6
Figure 6
Comparison of genetic load and inbreeding levels among different Rhododendron vialii populations. (a) Distribution of the inbreeding coefficient across all R. vialii populations. (b) Number of homozygous deleterious mutations among different populations. The Tamhane's test and Kruskal–Wallis test were employed for post hoc pairwise comparisons of F ROH and homozygous deleterious mutations, respectively: *P < 0.05; **P < 0.01; ***P < 0.001; ****P < 0.0001. The internal line within the box indicates the median value, the upper and lower bounds of the box represent the first and third quartiles, the whiskers represent the range of values, and the dots are outliers. (c) Venn diagram showing private or shared homozygous deleterious mutations among the selected five populations.

Similar articles

References

    1. Aguirre‐Liguori, J.A. , Ramírez‐Barahona, S. & Gaut, B.S. (2021) The evolutionary genomics of species' responses to climate change. Nature Ecology & Evolution, 5, 1350–1360. - PubMed
    1. Alexander, D.H. , Novembre, J. & Lange, K. (2009) Fast model‐based estimation of ancestry in unrelated individuals. Genome Research, 19, 1655–1664. - PMC - PubMed
    1. Allendorf, F.W. (2017) Genetics and the conservation of natural populations: allozymes to genomes. Molecular Ecology, 26, 420–430. - PubMed
    1. Ao, Y.S. , Chang, Y.H. , Liu, D.T. , Liu, Y.B. & Ma, Y.P. (2022) Does the critically endangered Rhododendron amesiae deserve top priority for conservation? Plant Diversity, 44, 625–628. - PMC - PubMed
    1. Badgley, C. , Smiley, T.M. , Terry, R. , Davis, E.B. , DeSantis, L.R.G. , Fox, D.L. et al. (2017) Biodiversity and topographic complexity: modern and geohistorical perspectives. Trends in Ecology & Evolution, 32, 211–226. - PMC - PubMed

LinkOut - more resources