. 2025 Dec;17(1):2495859.
doi: 10.1080/19490976.2025.2495859. Epub 2025 Apr 27.

Gut microbes-spinal connection is required for itch sensation

Affiliations

Gut microbes-spinal connection is required for itch sensation

Tong Jin et al. Gut Microbes. 2025 Dec.

Abstract

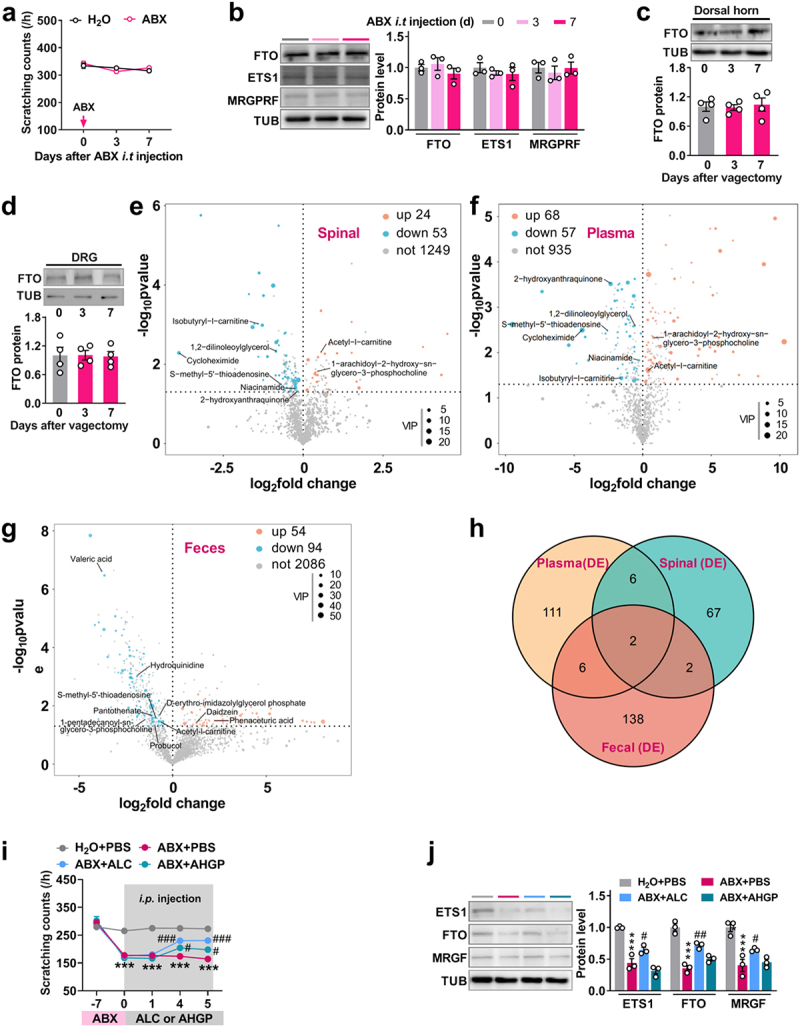
The gut microbiota has been linked to a number of neurological disorders. However, it is unclear whether the gut microbiota is involved in the genesis of chronic itch, a refractory condition that afflicts patients both physically and mentally. Here, we report that depletion of gut microbiota enhances tolerance to itch in mice orally administered with antibiotics (ABX) and mice free of germ. Of note, oral gavage with Bacteroides fragilis (B. fragilis), a prominent species of the genus Bacteroides with most differential change, corrected the ABX-induced itch dysfunction through its driven metabolite acetyl-l-carnitine (ALC). Mechanistically, gut microbiota or B. fragilis depletion caused a decrease in RNA N6-methyladenosine (m6A) demethylase FTO expression in the dorsal horn and a consequent increase in RNA m6A sites in Mas-related G protein-coupled receptor F (MrgprF) mRNA, leading to decreased MRGPRF protein. The downregulation of FTO was triggered by inactivation of ETS proto-oncogene 1 (ETS1), a transcription factor that binds to the Fto promoter. These findings support a gut microbe - spinal connection in modulation of itch sensation in RNA m6A epigenetic-dependent manner and highlight a critical role of ALC in linking the altered B. fragilis and itch dysfunction.

Keywords: B. fragilis; FTO; Gut microbe; RNA m6A; acetyl-l-carnitine; itch.


Conflict of interest statement

No potential conflict of interest was reported by the author(s).

Figures

Figure 1.
Figure 1.
The tolerance to itch occurs after depletion of the gut microbiota. (a) time line and schedule showing treatment with antibiotics (ABX), housing conditions (Abx + housed), itch behavior test sessions, 16S rDNA gene sequencing (16S rDNA-seq), and metagenomic sequencing (Metagenomic-Seq). (b) Principal coordinates analysis (PCoA) of gut microbiota composition for three groups: naïve (H2O), ABX, and ABX + housed through 16S rDNA sequencing. n = 3 or 4 mice/group. Please note that two of the three data points from the ABX samples are too close together, resulting in overlapping markers in the plot. (c) Circos analysis displaying the corresponding abundance relationship between samples and bacterial communities at phylum level via 16S rDNA sequencing. n = 3 or 4 mice/group. (d, e) the circos analysis was performed on the genus (d) and species (e) of bacteria that exhibited higher abundance on day 7 after being housed in the gut of ABX-treated mice, utilizing metagenomic sequencing. n = 4 mice/group. f, housed with naïve mice blocks a tolerance to itch induced by reduction of gut microbiota. Scratching bouts (/h) in response to chloroquine from day 0 to day 14 after the start of ABX treatment (or water control) in naïve adult mice, and from day 7 to day 14, when mice were housed with naïve mice. **p < 0.01, ***p < 0.001 versus H2O control group; ##P < 0.01 versus ABX, two-way ANOVA, n = 8 mice/group. (g) Fecal microbiota transplantation (FMT) from naïve adult mice inhibits the ABX-caused tolerance to itch. **p < 0.01, ***p < 0.001 versus H2O; ##P < 0.01, ###P < 0.001 versus ABX, two-way ANOVA, n = 8 mice/group. Fecal microbiota of naïve mice was transplanted into the ABX mice via oral gavage starting from day 0. (h) the analysis of scratching bouts in response to chloroquine in adult male germ-free mice. ***p < 0.001 versus naïve male mice. Student t’ test. n = 8 mice/group.
Figure 2.
Figure 2.
Deletion of the gut microbiota decreases the level of FTO expression in the dorsal horn. (a) the mRNA expression of m6A methyltransferases (Mettl3, Mettl14, and Wtap) and demethylases (Fto and Alkbh5) in the dorsal horn in mice lacking microbiota. Fto: **p < 0.0001, two-way ANOVA, post hoc Tukey’s test. n = 4 mice/group. (b) the level of METTL3, METTL14, and WTAP and FTO and ALKBH5 protein in the dorsal horn in mice lacking microbiota. ***p < 0.05, two-way ANOVA, post hoc Tukey’s test. n = 3 mice/group. (c, d) FTO expression in the dorsal horn on day 7 after ABX treatment. n = 4 mice (biological repeats). Scale bar, 50 μm. (e, f) FTO (green) distribution in different cellular types: neuron (red, NeuN), microglia (red, Iba1), astrocytes (red, GFAP). n = 4 mice (biological repeats). Scale bar, 50 μm.
Figure 3.
Figure 3.
ETS1 downregulation inactivates FTO expression in the dorsal horn following depletion of gut microbiota. (a) the expression level of seven consensus transcription factors–E2f4, E2f6, Ets1, Tcf12, Zic2, Bcl6, and Etv4—in the dorsal horn on days 3, 7, and 14 after the start of ABX treatment. **p < 0.05, ***p < 0.01 versus day 0, two-way ANOVA, post hoc Tukey’s test. n = 4 mice/group. (b) ETS1 protein level on days 3, 7, and 14 after the start of ABX treatment in the dorsal horn. ##P < 0.05, **p < 0.01 versus day 0, one-way ANOVA test post hoc Tukey’s test. n = 4 mice/group. (c) two ETS1 binding motif regions located, respectively, at  −  1041 to  −  1009 and  −  20 to  −  6 of the mouse F to promoter (transcription start site designated as  +  1). (d) Fto promoter fragment immunoprecipitated by rabbit anti-ETS1 antibody in the ipsilateral dorsal horn on day 7 after the start of ABX treatment. Input: total purified fragments. IgG: purified rabbit IgG. M: DNA ladder marker. ***p < 0.05 versus the H2O group; two-tailed unpaired Student’s t test. n = 4 mice/group. e, the expression of Ets1 mRNA in HT-22 cells at 48 h after injection of the Ets1 siRNA (si-Ets1) si-94 and si-396. ##P < 0.05 versus Scr, one-way ANOVA test, post hoc Tukey’s test. n = 5. f, luciferase reporter construction. pGL6: empty vector. Fto-P, fto promoter containing  −  1173 to  +  1 (the first nucleotide of transcription start site is designed as  +  1). g, h Fto promoter activity at 36 h in HEK-293T cells transfected with Ets1 siRNA (g) or at 48 h with Ets1 full-length expression plasmid (h). Scr: Scrambled siRNA treatment. si-Ets1, si-Ets1–94 treatment. pGL6: empty vector control. pGL6-P: pGL6 reporter with fto promoter. Ets1: Lentivirus expressing full-length Ets1. Gfp: lentivirus expressing Gfp control. ###P < 0.05 versus Scr (g) or Lenti-Gfp (h); two-tailed unpaired Student’s t test. n = 4. i, the expression of ETS1 and FTO protein in the dorsal horn on day 3 after intrathecal injection of Ets1 siRNA or its control scrambled siRNA. ***p < 0.001, one-way ANOVA test, post hoc Tukey’s test. n = 4 mice/group. (j) Heat-map analysis of scratching bouts in response to chloroquine in naïve mice after intrathecal injection of Ets1 siRNA. The left 0, 3, 4 and 5 refer to days after siRNA injection. The right from 1 to 8, the individual 8 mice. k, Level of ETS1 and FTO protein in the dorsal horn on day 5 after Lenti-Ets1 or Lenti-Gfp injection in ABX with 7 days treatment. ***p < 0.05, *p < 0.01 versus corresponding groups, one-way ANOVA test, post hoc Tukey’s test. n = 4 mice/group. (l) Heat-map analysis of scratching bouts in response to chloroquine in ABX mice on day 5 after intrathecal injection of Lenti-Ets1 or Lenti-Gfp. n = 6 mice/group.
Figure 4.
Figure 4.
Rescuing the decrease in dorsal horn FTO alleviates itch tolerance induced by depletion of gut microbiota. (a, b) the level of Fto mRNA (a) and protein (b) in the dorsal horn on day 5 after intrathecal injection of Lenti-Fto (Fto) or Lenti-Gfp (Gfp) in mice treated with ABX for 7 days. **p < 0.05, ***p < 0.01, ##P < 0.001 versus corresponding groups, one-way ANOVA, post hoc Tukey’s test. n = 4 mice/group. c, time course of the effect of injection of Lenti-Fto (Fto) or Lenti-Gfp (Gfp) on scratching bouts to chloroquine in mice treated with ABX. **p < 0.01 versus H2O + Gfp; ***p < 0.01, ##P < 0.001 versus ABX + Gfp at the corresponding time points; two-way ANOVA, post hoc Tukey’s tests. n = 8 mice/group. Red bar, ABX or H2O administration. Blue arrow, lenti-fto or Lenti-Gfp injection. d, Heat-map analysis of scratching bouts to chloroquine on day 5 after intrathecal injection of Lenti-Fto (Fto) in mice treated with ABX. The left 0, 3, 4 and 5 refer to days after Lenti-Fto injection. The right 1, 2, 3 and 4, the repeated 4 times. (e, f) The level of fto mRNA (e) and protein (f) in mice after intrathecal injection of Fto siRNA  −  403 or  −  66. ###P < 0.001 versus scr, one-way ANOVA, post hoc Tukey’s tests. n = 3–4 mice/group. g, Time course of the effect of injection of fto-siRNA (siR) or scrambled siRNA (scr) on scratching bouts to chloroquine in naïve mice. ***p < 0.05, ***p < 0.01 versus the scr group at the corresponding time points. Two-way ANOVA, post hoc Tukey’s tests. n = 7 mice/group, blue arrow, Fto-siRNA or Scr injection. (h, i) Scratching bouts to chloroquine in naïve mice on days 3, 4, and 5 after intrathecal injection of Fto siRNA-403 (h) or  −  66 (i). The left 0, 3, 4 and 5 refer to days after siRNA injection. The right 1, 2, 3 and 4, the individual 4 mice. j, k, Dorsal horn Fto mRNA (j) and protein (k) in mice after intrathecal injection of Lenti-Fto-shRNA (shRNA) or Lenti-Scr-shRNA (Scr). *p < 0.01, *p < 0.001 versus Scr, two-tailed unpaired Student’s t test, n = 3–4 mice/group. l, Time course of scratching bouts to chloroquine in naïve mice after intrathecal injection of Fto-shRNA (shRNA) or Lenti-Scr-shRNA (Scr). **p < 0.05, *p < 0.01 versus Scr, two-way ANOVA, post hoc Tukey’s tests. n = 7 mice/group.
Figure 5.
Figure 5.
ABX-induced downregulation of FTO results in m6A-dependent downregulation of MrgprF. (a) the levels of MrgprB, MrgprE, MrgprF, and Tripv1 mRNA in the dorsal horn on day 7 of ABX treatment. **p < 0.01 versus Scr, two-tailed unpaired Student’s t test. n = 4 mice/group. b, c Time-course analysis of MrgprF mRNA (b) and protein (c) expression in the dorsal horn after ABX treatment. ***p < 0.05, ##P < 0.01, **p < 0.001versus day 0, one-way ANOVA, post hoc Tukey’s tests. n = 4 mice/group. d, e, the levels of Fto and MrgprF mRNA (d) and protein (e) in the dorsal horn on day 5 after intrathecal injection of Lenti-Fto (Fto) or Lenti-Gfp (Gfp) in mice treated with ABX for 7 days. ***p < 0.05, ##P < 0.01, ###P < 0.001 versus the corresponding groups, one-way ANOVA, post hoc Tukey’s tests. n = 3–4 mice/group. (f, g) the level of dorsal horn fto and MrgprF mRNA (f) and protein (g) on day 2 after intrathecal injection of Fto-siRNA (si-Fto) or scrambled siRNA (Scr) in naïve mice. ***p < 0.01, ***p < 0.001 versus Scr groups, two-tailed unpaired student’s t test. n = 4–5 mice/group. (h, i) the level of fto and MrgprF mRNA (h) and protein (i) in the dorsal horn on day 5 after intrathecal injection of Lenti-Fto-shRNA (sh-Fto) or scrambled siRNA (sh-Scr) in naïve mice. *p < 0.01, *p < 0.001 versus sh-Scr groups, two-tailed unpaired Student’s t test. n = 3–4 mice/group. j, the predicted location of the m6A motif (GGACR. R represents A, C, or U) in the 3’UTR of MrgprF mRNA. The forward and reverse arrows represent paired RT-PCR primers. a-c, the three m6A motif regions in the MrgprF 3’UTR. F and R, the designed PCR primer pairs to amplify the specific m6A motifs. k, Detection of the three corresponding m6A motifs on day 7 after ABX treatment via RNA immunoprecipitation (RIP)-PCR using the three PCR primer pairs. **p < 0.01 versus Scr, two-tailed unpaired Student’s t test. n = 3 mice/group. l, RIP-PCR with anti-m6A revealed the m6A level at the MrgprF 3’UTR (c motif site in Figure 5(j)) on day 5 after intrathecal injection of Lenti-Fto (Fto) or Lenti-Gfp (Gfp) in mice treated with ABX for 7 days. *p < 0.001 versus corresponding groups, one-way ANOVA, post hoc Tukey’s tests. n = 3 mice/group. m, MrgprF m6A level on day 2 after injection of Fto-siRNA or Scr control in naive mice. **p < 0.01 versus Scr, two-tailed unpaired student’s t test. n = 3 mice/group. n, the level of YTHDF2 protein in the dorsal horn on day 7 after the start of ABX treatment. n = 4 mice/group. o, MrgprF mRNA stability in naïve mice after Ythdf2-siRNA or Scr for 2 consecutive days, and after one-time intrathecal injection of actinomycin D (act-D, 10 mg). *p < 0.05 versus Scr, two-way ANOVA, post hoc Tukey’s tests. n = 3 mice/group.
Figure 6.
Figure 6.
Specific regulation of m6A in MrgprF 3’UTR alters the expression of MRGPRF. (a) CRISPR-dCasrx “erasing” (upper) or “writing” (lower) m6A in the given 3’UTR of MrgprF mRNA. gRNA, small guide RNA. 685 to 689 represents the locations of the c m6A motif site in the MrgprF 3’UTR. The first nucleotide of the 3’UTR is designated as  +  1. (b, c) Identification of dCasrx-FTO (b) or dCasrx-METTL3 (c) fusion protein expression on day 5 after intrathecal injection of CRISPR-dCasrx-Fto (dCasrx/FTO) or CRISPR-dCasrx-Mettl3 (dCasrx/M3). (d) Time line and schedule showing treatment with ABX, CRISPR-dCasrx/fto injection, itch behavior test, and MrgprF m6A and protein level analysis. e, f, Analysis of m6A levels in MrgprF 3’UTR (e) and MRGPRF and FTO protein expression (f) on day 5 after co-injection of CRISPR-dCasrx-fto and gRNA-490 or gRNA-611 in mice pretreated with ABX for 7 days. **p < 0.05, ***p < 0.01 versus corresponding groups, one-way ANOVA, post hoc Tukey’s tests. n = 4 mice/group. gRNA-490 (490 to 510, first nucleotide in the 3’UTR is designated as  +  1) and gRNA-611 (611 to 631) were designed to bind close to the c site in the MrgprF 3’UTR. g, Heat-map analysis of scratch to chloroquine on day 5 after co-injection of CRISPR-dCasrx-Fto (dCas/F) and gRNA-611 or scrambled gRNA (Scr) in ABX mice. n = 4 mice/group. (h) Time line and schedule showing CRISPR-dCasrx/mettl3 injection, itch behavior test, and MrgprF m6A and protein level analysis. (i, j) the level of MrgprF m6A (i) and MRGPRF and METTL3 protein expression (j) on day 5 after co-injection of CRISPR-dCasrx-Mettl3 and gRNA-611 in naïve mice. ##P < 0.05, **p < 0.01 versus corresponding groups, one-way ANOVA, post hoc Tukey’s tests(i). ***p < 0.05, ##P < 0.01 versus scrambled gRNA (Scr) group, two-tailed unpaired Student’s t test (j). n = 4 mice/group. (k) Heat map analysis of scratch to chloroquine on day 5 after co-injection of CRISPR-dCasrx-Mettl3 (dCasR/m3) and gRNA-611 scrambled gRNA (Scr) in naïve mice. n = 4 mice/group. (l) Time course of the effect of upregulating MrgprF with Lenti-MrgprF on the itch tolerance induced by Fto knockdown by siRNA. ###P < 0.05, ***p < 0.001 versus the Scr + Lenti-Gfp group; ***p < 0.05 versus Fto-siRNA + Lenti-Gfp. Two-way ANOVA, post hoc Tukey’s test. n = 8 mice/group.
Figure 7.
Figure 7.
Bacteroides fragilis participates in modulation of itch. (a) the relative level of B. fragilis abundance in the gut of mice after ABX treatment and co-housing with normal mice. The data is sourced from metagenomic sequencing. **p < 0.05 versus the H2O group. One-way ANOVA, post hoc Tukey’s test. n = 4 mice/group. (b) Time-course analysis of the effect of oral treatment with human B. fragilis on itch behavior in ABX mice. ***p < 0.01, ##P < 0.001 versus the H2O group; **p < 0.01, ***p < 0.001 versus the ABX group; $$p <0.01, $$$p <0.001 versus the H2O group. Two-way ANOVA, post hoc Tukey’s test. n = 8 mice/group. (c) Heat-map analysis of itch behavior on day 5 after B. fragilis treatment in ABX mice. n = 6 mice/group. (d) Heat-map analysis of the effect on basal itch behavior on day 5 after B. fragilis treatment in naïve mice. n = 6 mice/group. (e) the effect of B. fragilis transplantation on scratching bouts to chloroquine in germ-free mice. ##P < 0.05 versus the naïve group; ###P < 0.01, ***p < 0.001 versus the germ-free group; Two-way ANOVA, post hoc Tukey’s tests. n = 8 mice/group. (f) the levels of FTO, EST1, and MRGPRF expression levels in the dorsal horn on day 7 after oral gavage of B. fragilis in germ-free mice. ***p < 0.05, *p < 0.01, *p < 0.001 versus the corresponding groups; One-way ANOVA, post hoc Tukey’s test. n = 3 mice/group.
Figure 8.
Figure 8.
Acetyl-l-carnitine supplementation ameliorates itch dysfunction induced by the reduction of gut microbiota. a, the effect of intrathecal injection of ABX on the itch threshold in naïve mice. n = 6 mice/group. b, the expression level of dorsal horn FTO, EST1, and MRGPRF on days 3 and 7 after intrathecal injection of ABX in naïve mice. n = 3 mice/group. (c, d) FTO expression levels in the dorsal horn (c) and DRG (d) on days 3 and 7 after vagectomy surgery. One-way ANOVA, post hoc Tukey’s test. n = 4 mice/group. (e-g) the analysis of differential metabolites in the spinal dorsal horn (e), blood plasma (f), and feces (g) through using LC-MS/MS on day 7 after transplantation of B. fragilis in germ-free mice. Up, upregulated; down, downregulated; not, not changed. Spinal, dorsal spinal horn. n = 3 (for spinal and plasma) or 4 (for feces) mice/group. (h) the analysis of overlapping differential metabolites among the dorsal horn, plasma, and feces. DE, differential expression metabolites including up and down. (i) the time course of scratching bouts in response to chloroquine after the intraperitoneal injection of acetyl-l-carnitine (ALC) or 1-arachidoyl-2-hydroxy-sn-glycero-3-phosphocholine (AHGP) in ABX mice for continuous 5 days. **p < 0.001 versus the H2O + PBS group; ***p < 0.05, ##P < 0.001 versus the ABX + PBS group. Two-way ANOVA, post hoc Tukey’s test. n = 8 mice/group. j, the expression level of dorsal horn FTO, EST1, and MRGPRF on 5 after administration of ALC in ABX mice. n = 3 mice/group. **p < 0.001 versus the H2O + PBS group; ***p < 0.05, ##P < 0.01 versus the ABX + PBS group. One-way ANOVA, post hoc Tukey’s test. n = 3 mice/group.
Figure 9.
Figure 9.
Schematic strategy for ALC’s role in improving itch dysfunction induced by deletion of gut microbiota via the gut‑spinal axis in FTO-dependent manner. Reduction of gut microbiota down-regulates FTO expression in the dorsal horn. This downregulation is attributed to a reduction in the binding of ETS1 to the Fto promoter in dorsal horn neurons. Downregulation of FTO results in an increase in m6A in the MrgprF 3’UTR, triggering inhibition of MRGPRF protein expression and consequent genesis of itch tolerance. Treatment with B. fragilis can restore normal itch behavior through its derived metabolites acetyl-l-carnitine in mice with microbiota depletion.

References

    1. Koch SC, Acton D, Goulding M.. Spinal circuits for touch, pain, and itch. Annu Rev Physiol. 2018;80(1):189–31. doi: 10.1146/annurev-physiol-022516-034303. - DOI - PMC - PubMed
    1. Matterne U, Apfelbacher CJ, Loerbroks A, Schwarzer T, Buttner M, Ofenloch R, Diepgen T, Weisshaar E. Prevalence, correlates and characteristics of chronic pruritus: a population-based cross-sectional study. Acta dermato-venereologica. 2011;91(6):674–679. doi: 10.2340/00015555-1159. - DOI - PubMed
    1. Morita T, McClain SP, Batia LM, Pellegrino M, Wilson SR, Kienzler MA, Lyman K, Olsen A, Wong J, Stucky C, et al. HTR7 mediates serotonergic acute and chronic itch. Neuron. 2015;87(1):124–138. doi: 10.1016/j.neuron.2015.05.044. - DOI - PMC - PubMed
    1. Abu YF, Singh S, Tao J, Chupikova I, Singh P, Meng J, Roy S. Opioid-induced dysbiosis of maternal gut microbiota during gestation alters offspring gut microbiota and pain sensitivity. Gut Microbes. 2024;16(1):2292224. doi: 10.1080/19490976.2023.2292224. - DOI - PMC - PubMed
    1. Rong ZJ, Chen M, Cai HH, Liu GH, Chen JB, Wang H, Zhang Z-W, Huang Y-L, Ni S-F. Ursolic acid molecules dock MAPK1 to modulate gut microbiota diversity to reduce neuropathic pain. Neuropharmacology. 2024;252:109939. doi: 10.1016/j.neuropharm.2024.109939. - DOI - PubMed

MeSH terms

Substances