. 2025 Aug;69(15):e70075.
doi: 10.1002/mnfr.70075. Epub 2025 Apr 27.

Resveratrol Prevents Weight Gain, Counteracts Visceral Adipose Tissue Dysfunction, and Improves Hypothalamic Leptin Sensitivity in Diet-Induced Obese Rats

Affiliations

Resveratrol Prevents Weight Gain, Counteracts Visceral Adipose Tissue Dysfunction, and Improves Hypothalamic Leptin Sensitivity in Diet-Induced Obese Rats

Maria Ibars-Serra et al. Mol Nutr Food Res. 2025 Aug.

Abstract

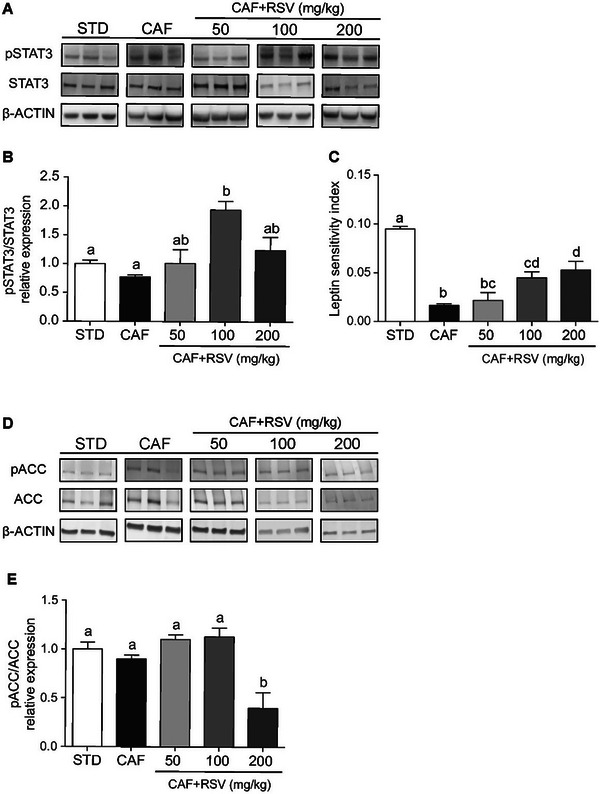
In obesity, increased adipocyte size is associated with metabolic complications, while elevated adipocyte numbers are considered a protective mechanism against metabolic disturbances. Adipose tissue dysfunction leads to decreased leptin sensitivity and disrupted energy balance regulation. Resveratrol (RSV), a bioactive compound known for potential health benefits, including obesity-related disorder prevention, has unclear modulatory effects on adipocyte dysfunction and leptin signaling in established obesity. This study investigated the impact of RSV on adiposity and hypothalamic leptin sensitivity in obesity. Rats were fed a cafeteria diet for 9 weeks and subsequently supplemented with different doses of RSV for 22 days. The 200 mg/kg RSV dose reduced leptin concentrations, body weight gain, and body fat mass in obese animals, while mitigating adipocyte hypertrophy and promoting adipocyte hyperplasia in the retroperitoneal fat depot. RSV also improved hypothalamic leptin sensitivity, shedding light on the molecular mechanisms underlying the benefits of RSV consumption for obesity-related disorders.

Keywords: WAT; cafeteria; hypothalamus; liver; obesity; polyphenols.


Conflict of interest statement

The authors declare no conflicts of interest.

Figures

FIGURE 1
FIGURE 1
Effect of resveratrol treatment on RER and energy expenditure of obese rats. 16‐h indirect calorimetry, displayed as the respiratory exchange ratio (RER) hourly measurements (A), average 16‐h RER (B), energy expenditure hourly measurements (C), and average 16‐h energy expenditure (D). Animals were fed a STD or a CAF diet for 9 weeks. After this, STD group was supplemented with vehicle (n = 6) and CAF group (n = 18) was divided in three groups. Animals received either a daily low dose of 50 mg/kg (CAF+50), a medium dose of 100 mg/kg (CAF+100), or a high dose of 200 mg/kg (CAF+200) of resveratrol for a period of 22 days. Values are mean ± SEM of six animals per group. Significant differences (p ≤ 0.05) in graphs A and C were assessed by repeated‐measures ANOVA; t, time effect; T, resveratrol treatment effect, and t × T interaction of time and resveratrol treatment. Significant differences (p ≤ 0.05) in graphs B and D were assessed by one‐way ANOVA followed by post‐hoc multiple comparisons tests Tukey or Dunnett's T3 according to Levene's test. Different letters denote significant difference between groups.
FIGURE 2
FIGURE 2
Effect of three different doses of resveratrol administration on adipocyte size and number in retroperitoneal white adipose tissue of obese rats. Samples of retroperitoneal white adipose tissue (rWAT) were stained with hematoxylin and eosin. Representative light microscopy images captured at 20× magnification from each group (A) were used to measure adipocyte area (B), adipocyte volume (C), and the frequency of adipocyte size (D). Total adipocyte number (E) was extrapolated from the size of adipocytes and the weight of rWAT. Animals were fed a STD or a CAF diet for 9 weeks. After this, STD group was supplemented with vehicle (n = 6) and CAF group (n = 18) was divided in three groups. Animals received either a daily low dose of 50 mg/kg (CAF+50), a medium dose of 100 mg/kg (CAF+100), or a high dose of 200 mg/kg (CAF+200) of resveratrol for a period of 22 days. The values are the mean ± SEM of five fields per animal from three animals per group. Different letters indicate significant differences (≤ 0.05) assessed by one‐way ANOVA statistical analysis followed by multiple comparisons tests Tukey or Dunnett's T3 according to Levene's test.
FIGURE 3
FIGURE 3
Effect of resveratrol administration on mRNA levels of genes related to adipogenesis in retroperitoneal white adipose tissue of obese rats. Peroxisome proliferator‐activated receptor gamma (Pparγ) (A); fatty acid binding protein 4 (Fabp4) (B); Lipoprotein Lipase (Lpl) (C); Leptin (Lep) (D) mRNA levels. Animals were fed a STD or a CAF diet for 9 weeks. After this, STD group was supplemented with vehicle (n = 6) and CAF group (n = 18) was divided in three groups. Animals received either a daily low dose of 50 mg/kg (CAF+50), a medium dose of 100 mg/kg (CAF+100), or a high dose of 200 mg/kg (CAF+200) of resveratrol for a period of 22 days. The values are the mean ± SEM of six animals per group. Different letters indicate significant differences (p ≤ 0.05) assessed by one‐way ANOVA statistical analysis followed by multiple comparisons tests Tukey or Dunnett's T3 according to Levene's test.
FIGURE 4
FIGURE 4
Effect of resveratrol administered on mRNA levels of genes related to lipid metabolism in retroperitoneal white adipose (rWAT) of diet‐induced obese rats. Fatty acid synthase (Fasn) (A), carnitine palmitoyltransferase 1B (Cpt1b) (B), ATP binding cassette subfamily A member 1 (Abca1) (C), insulin receptor substrate 2 (Irs2) (D), sterol regulatory element binding protein 2 (Srebp2) (E), and miR‐33a levels (F). Animals were fed a STD or a CAF for 9 weeks. After this, STD group was supplemented with vehicle (n = 6) and CAF group (n = 18) was divided in three groups. Animals received either a daily low dose of 50 mg/kg (CAF+50), a medium dose of 100 mg/kg (CAF+100), or a high dose of 200 mg/kg (CD+200) of resveratrol for a period of 22 days. The values are the mean ± SEM of six animals per group. Different letters indicate significant differences (≤ 0.05) assessed by one‐way ANOVA statistical analysis followed by multiple comparisons tests Tukey or Dunnett's T3 according to Levene's test.
FIGURE 5
FIGURE 5
Protein expression of factors involved in leptin signaling in the hypothalamus. Expression levels of pSTAT3 assessed by immunoblot (A), pSTAT3 representation of average expression per group (B), pSTAT3/serum leptin ratio (C), expression levels of pACC assessed by immunoblot (D), and pACC/ACC representation of average expression per group (E). Intensity signals of each protein were normalized by β‐Actin. Animals were fed a STD or a CAF for 9 weeks. After this, STD group was supplemented with vehicle (n = 6) and the CAF group (n = 18) was divided in three groups. Animals daily received either a low dose of 50 mg/kg (CAF+50), a intermediate dose of 100 mg/kg (CAF+100), or a high dose of 200 mg/kg (CAF+200) of resveratrol for a period of 22 days. Values are mean ± SEM of six animals per group. Different letters indicate significant differences (≤ 0.05) assessed by one‐way ANOVA statistical analysis followed by multiple comparisons tests Tukey or Dunnett's T3 according to Levene's test.
FIGURE 6
FIGURE 6
Protein expression of factors involved in leptin signaling in the hypothalamus. Expression levels leptin receptor OBRB, SOCS3, and SIRT1 assessed by immunoblot (A), OBRB representation of average expression per group (B), SOCS3 representation of average expression per group (C), and SIRT1 representation of average expression per group (D). Intensity signals of each protein were normalized by β‐Actin. Animals were fed a STD or a CAF for 9 weeks. After this, the STD group was supplemented with vehicle (n = 6) and the CAF group (n = 18) was divided in three groups. Animals daily received either a low dose of 50 mg/kg (CAF+50), an intermediate dose of 100 mg/kg (CAF+100), or a high dose of 200 mg/kg (CAF+200) of resveratrol for a period of 22 days. Values are mean ± SEM of six animals per group. Different letters indicate significant differences (≤ 0.05) assessed by one‐way ANOVA statistical analysis followed by multiple comparisons tests Tukey or Dunnett's T3 according to Levene's test.

Similar articles

Cited by

References

    1. Di Angelantonio E., Bhupathiraju S. N., Wormser D., et al., “Body‐Mass Index and All‐Cause Mortality: Individual‐Participant‐Data Meta‐Analysis of 239 Prospective Studies in Four Continents,” Lancet 388 (2016): 776–786. - PMC - PubMed
    1. Shehzad A., Ha T., Subhan F., and Lee Y. S., “New Mechanisms and the Anti‐Inflammatory Role of Curcumin in Obesity and Obesity‐Related Metabolic Diseases,” European Journal of Nutrition 50 (2011): 151–161. - PubMed
    1. Jernås M., Palming J., Sjöholm K., et al., “Separation of Human Adipocytes by Size: Hypertrophic Fat Cells Display Distinct Gene Expression,” FASEB Journal 20 (2006): 1540–1542. - PubMed
    1. Bugianesi E., McCullough A. J., and Marchesini G., “Insulin Resistance: A Metabolic Pathway to Chronic Liver Disease,” Hepatology 42 (2005): 987–1000. - PubMed
    1. Wajchenberg B. L., Giannella‐Neto D., da Silva M. E., and Santos R. F., “Depot‐Specific Hormonal Characteristics of Subcutaneous and Visceral Adipose Tissue and Their Relation to the Metabolic Syndrome,” Hormone and Metabolic Research 34 (2002): 616–621. - PubMed

MeSH terms