. 2025 Jun;12(23):e2500554.
doi: 10.1002/advs.202500554. Epub 2025 Apr 28.

Erythropoietin-Stimulated Macrophage-Derived Extracellular Vesicles in Chitosan Hydrogel Rescue BMSCs Fate by Targeting EGFR to Alleviate Inflammatory Bone Loss in Periodontitis

Affiliations

Erythropoietin-Stimulated Macrophage-Derived Extracellular Vesicles in Chitosan Hydrogel Rescue BMSCs Fate by Targeting EGFR to Alleviate Inflammatory Bone Loss in Periodontitis

Shuchen Liu et al. Adv Sci (Weinh). 2025 Jun.

Abstract

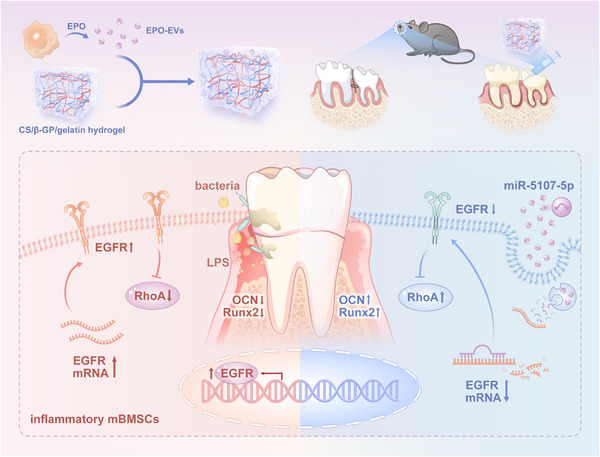
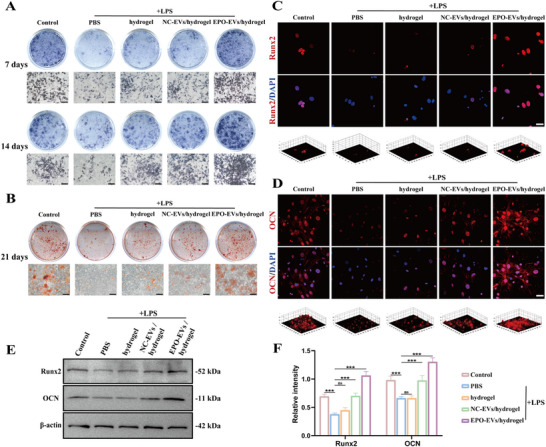
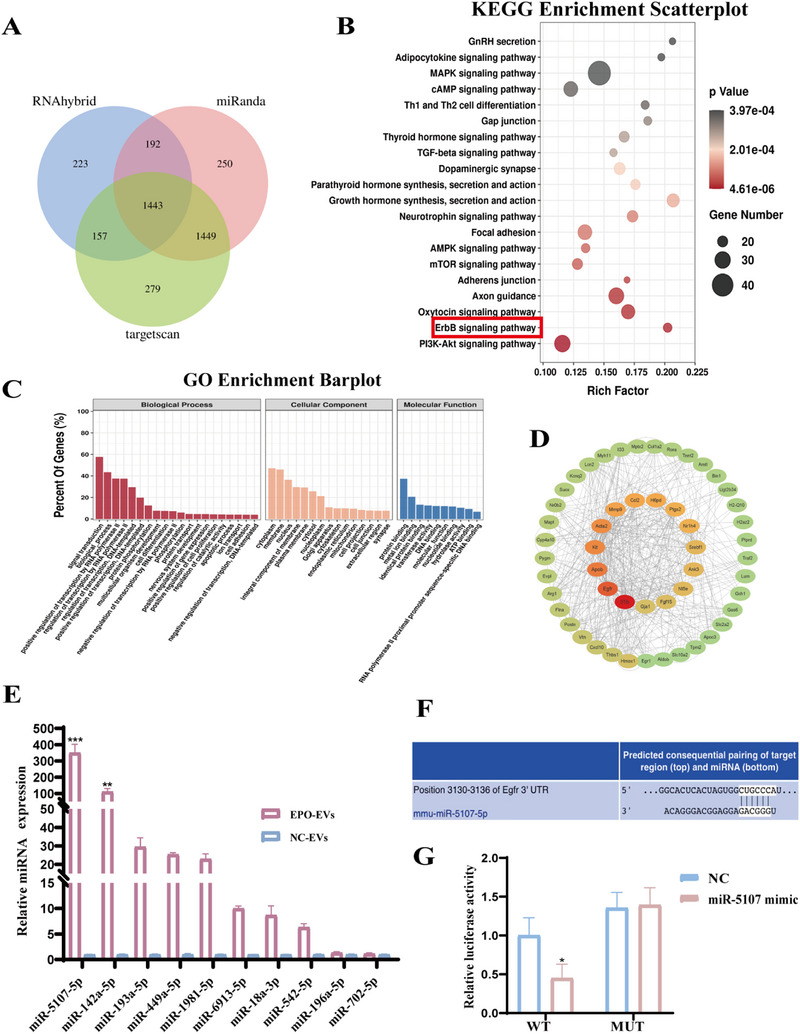
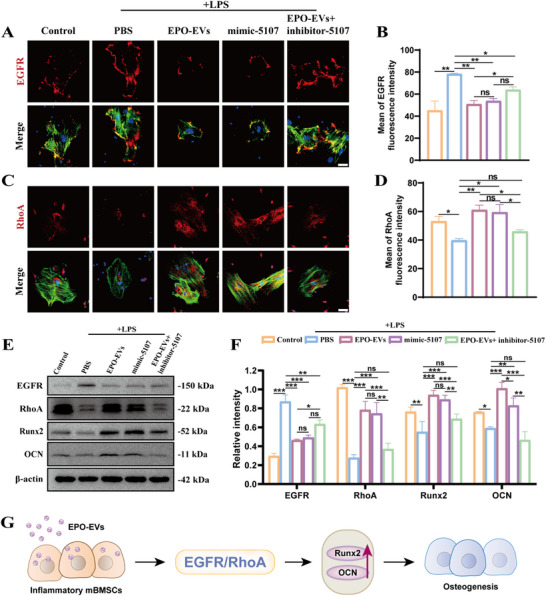
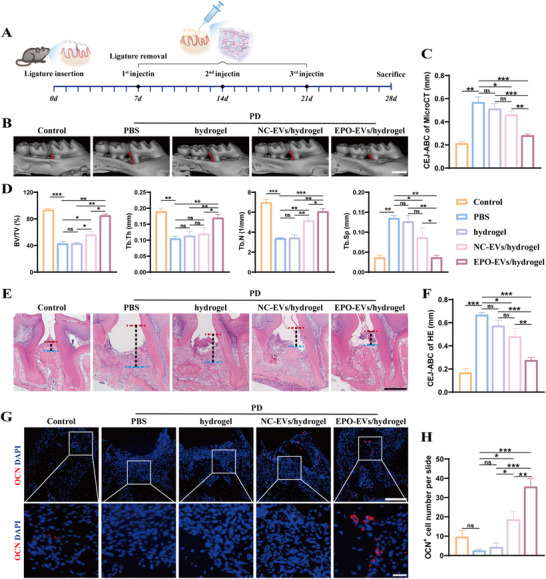
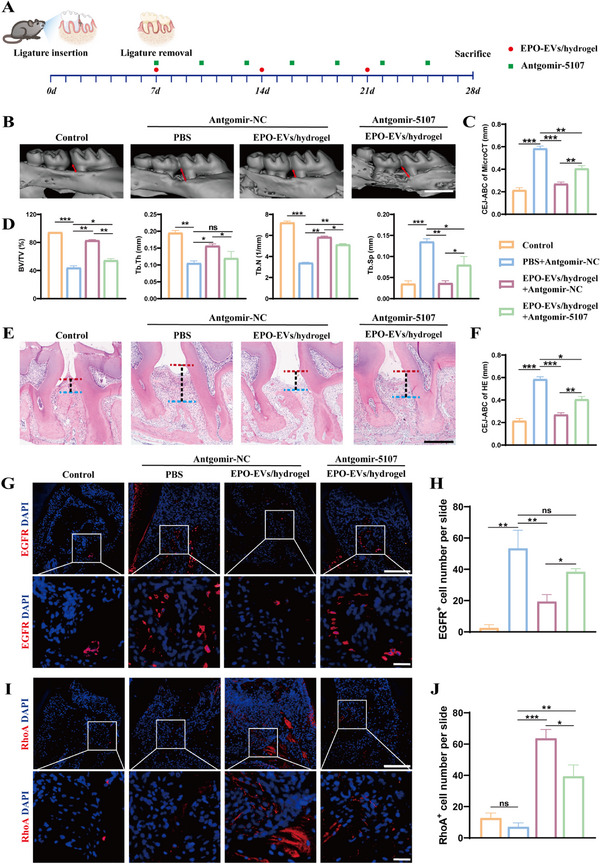
Loss of periodontal tissue due to persistent inflammation in periodontitis is a major cause of tooth loss in adults. Overcoming osteogenic inhibition in the inflammatory periodontal environment and restoring the regenerative capacity of endogenous bone marrow mesenchymal stem cells (BMSCs) remain critical challenges in current treatment approaches. Macrophage-derived extracellular vesicles (EVs) are key regulators of osteogenesis in recipient cells, yet the role of erythropoietin (EPO) in modifying macrophages and the function of their EVs in bone regeneration remain unclear. In this study, EVs from EPO-stimulated macrophages (EPO-EVs) are isolated, and they are encapsulated in a chitosan/β-sodium glycerophosphate/gelatin (CS/β-GP/gelatin) hydrogel to create a controlled-release EVs delivery system for localized periodontal environment. EPO-EVs restore the osteogenic function of mouse BMSCs (mBMSCs) and mitigate inflammatory bone loss in a periodontitis mouse model. Mechanistically, miR-5107-5p, significantly enriched in EPO-EVs, is delivered to mBMSCs, where it suppresses epidermal growth factor receptor (EGFR) expression and alleviates EGFR's inhibitory effect on RhoA. This process counteracts osteogenic inhibition in inflammatory settings through the EGFR/RhoA axis. Overall, EVs from EPO pretreated macrophages restore the osteogenic capacity of mBMSCs under inflammation by inhibiting EGFR expression, providing new insight into therapeutic mechanisms and offering a promising approach for future periodontitis treatment.

Keywords: epidermal growth factor receptor (EGFR); erythropoietin; extracellular vesicles (EVs); microRNAs; periodontitis.


Conflict of interest statement

The authors declare no conflict of interest.

Figures

Scheme 1
Scheme 1
Proposed therapeutic strategy for periodontitis using EVs derived from EPO‐stimulated macrophages. The schema shows that EPO‐EVs increase the osteogenic activity of mBMSCs in the inflammatory milieu through inhibiting EGFR. The abundant EV‐derived miR‐5107‐5p after EPO stimulation alleviates the inflammatory bone loss via the EGFR/RhoA axis.
Figure 1
Figure 1
Isolation and characterization of NC‐EVs and EPO‐EVs. A) Flow chart of NC‐EVs and EPO‐EVs isolation (Created by Figdraw). B) Representative TEM images of NC‐EVs and EPO‐EVs. Scale bar = 100 nm. C) Analysis of the size distribution of NC‐EVs and EPO‐EVs. D) Western blot analysis of EVs surface marker proteins (HSP70, CD63) and cytosolic marker (β‐actin) in RAW 264.7 (Cells), NC‐EVs and EPO‐EVs (EVs). E) Representative images of the uptake of PKH67‐labeled EVs by mBMSCs at the indicated time points after coculture. Scale bar = 50 µm. F) Flow cytometry quantity analysis of mBMSCs which uptake the PKH26‐labeled EVs at the indicated time points after coculture (n = 3) (ns. No significant difference). The data are analyzed using independent two‐tailed Student's t‐test and presented as mean value ± SD.
Figure 2
Figure 2
Characterization of EV‐encapsulated CS/β‐GP/gelatin hydrogel. A) Photographs of the freshly prepared pre‐gel solution and the hydrogel formed at body temperature. B) The pre‐gel solution was injected into irregular shapes. C) FTIR spectra of the lyophilized EV‐encapsulated hydrogels. D) Cross‐sectional morphologies of the hydrogels. Scale bar = 100 µm; Scale bar (Zoom) = 20 µm. The arrow denotes the EVs attached to the surface of the hydrogel. E) Representative 3D distribution of PKH26‐labeled EVs within the hydrogels. Scale bar = 100 µm.
Figure 3
Figure 3
Biocompatibility of the hydrogel and EVs retention evaluation within the hydrogel. A) Flow cytometry analysis of apoptotic cell percentages after coculture with extracts from different hydrogels. B) CCK‐8 assay was performed after 1, 3, and 7 days of incubation (n = 3) (* p < 0.05, ** p < 0.01, *** p < 0.001). The data are analyzed using ANOVA and presented as mean value ± SD. C) Cell viability assay after 7 days of cell culture, green and red cells represent live and dead cells, respectively. Scale bar = 200 µm. D) Cell viability rate (n = 3) (* p < 0.05, ** p < 0.01, *** p < 0.001). The data are analyzed using ANOVA and presented as mean value ± SD. E) The release curves of EVs from the hydrogels. F) Schematic diagram of the mouse model to test the biodistribution of EVs following local periodontal injection. G) In vivo representative bioluminescence images of the retention of DiR‐labeled EPO‐EVs in free form and hydrogel form following local periodontal injection at different time points. H) The fluorescence intensity was quantified accordingly using heatmap.
Figure 4
Figure 4
EPO‐EVs elevate osteogenic potential of mBMSCs in the inflammatory milieu in vitro. A) ALP staining images of mBMSCs on day 7and 14. Scale bar = 200 µm. B) Alizarin red staining images of mBMSCs on day 21. Scale bar = 200 µm. C) Immunofluorescence staining showed the expression of Runx2 on day 7. Scale bar = 50 µm. D) Immunofluorescence staining showed the expression of OCN on day 7. Scale bar = 50 µm. E) Western blot analysis of osteoblastic protein Runx2 and OCN in mBMSCs on day 7. F) Quantitative analysis of the relative intensity of WB bands in each group (n = 3) (* p < 0.05, ** p < 0.01, *** p < 0.001, ns. No significant difference). The data are analyzed using ANOVA and presented as mean value ± SD.
Figure 5
Figure 5
Analysis of the differential expression of miRNAs between NC‐EVs and EPO‐EVs. A) Three bioinformatics tools (TargetScan, RNAhybrid, and miRanda) were used to analyze genes targeted by top ten upregulated DEMs. B) KEGG enrichment analysis results were obtained by scatter plots. C) GO classification of the genes—biological process, cellular component, and molecular function. D) All genes targeted by top ten upregulated DEMs were shown in the PPI network. E) qPCR analysis showed the expression of miRNAs in NC‐EVs and EPO‐EVs (n = 3) (* p < 0.05, ** p < 0.01, *** p < 0.001). The data are analyzed using independent two‐tailed Student's t‐test and presented as mean value ± SD. F) The binding site between EGFR (position 3130–3136 of EGFR 3′ UTR) and miR‐5107‐5p as predicted by the TargetScan website. G) Luciferase activity in HEK‐293 cells transfected with EGFR‐Wt/Mut and mimic‐5107 or mimic‐NC (n = 3) (* p < 0.05). The data are analyzed using independent two‐tailed Student's t‐test and presented as mean value ± SD.
Figure 6
Figure 6
Abundant miR‐5107‐5p in EPO‐EVs promotes the osteogenic differentiation of inflamed mBMSCs. A) Immunofluorescence staining showed the expression of EGFR in the mBMSCs of each group. Nuclei were stained with DAPI. Scale bar = 50 µm. B) Comparative analysis of the fluorescence intensity of the expression of EGFR in the mBMSCs of each group (n = 3) (* p < 0.05, ** p < 0.01, *** p < 0.001, ns. No significant difference). The data are analyzed using ANOVA and presented as mean value ± SD. C) Immunofluorescence staining showed the expression of RhoA in the mBMSCs of each group. Nuclei were stained with DAPI. Scale bar = 50 µm. D) Comparative analysis of the fluorescence intensity of the expression of RhoA in the mBMSCs of each group (n = 3) (* p < 0.05, ** p < 0.01, *** p < 0.001, ns. No significant difference). The data are analyzed using ANOVA and presented as mean value ± SD. E) Western blot analysis of EGFR, RhoA, Runx2, and OCN in mBMSCs from each group. F) Quantitative analysis of the relative intensity of WB bands in each group (n = 3) (* p < 0.05, ** p < 0.01, *** p < 0.001, ns. No significant difference). The data are analyzed using ANOVA and presented as mean value ± SD. G) Schematic diagram of EPO‐EVs‐induced osteogenic differentiation of mBMSCs.
Figure 7
Figure 7
EPO‐EVs alleviate inflammatory alveolar bone loss in periodontitis mice. A) Schematic illustration for ligature‐induced periodontitis mouse model construction and the time point of local periodontal injection. B) 3D reconstruction of the maxillary samples in each group by micro‐CT scan. The red double arrows extend from the CEJ to the apex of the ABC. Scale bar = 1 mm. C) Quantification analysis of the distance from CEJ to ABC in each group as determined by micro‐CT (n = 5) (* p < 0.05, ** p < 0.01, *** p < 0.001, ns. No significant difference). The data are analyzed using ANOVA and presented as mean value ± SD. D) Quantitative analysis of BV/TV, Tb. Th, Tb. N and Tb. Sp. (n = 5) (* p < 0.05, ** p < 0.01, *** p < 0.001, ns. No significant difference). The data are analyzed using ANOVA and presented as mean value ± SD. E) Histological H&E staining of the periodontium in each group. The vertical lines extend from the CEJ to the ABC. Scale bar = 100 µm. F) Quantification analysis of the distance from CEJ to ABC in each group as determined by H&E staining (n = 5) (* p < 0.05, ** p < 0.01, *** p < 0.001, ns. No significant difference). The data are analyzed using ANOVA and presented as mean value ± SD. G) Immunofluorescence staining showed the expression of OCN in the periodontium of each group. Nuclei were stained with DAPI. Scale bar = 100 µm; Scale bar (Zoom) = 20 µm. H) Statistical analysis of the IF staining of periodontal OCN+ cells in each group (n = 5). The number of OCN+ cells was quantified for each microscope field of view (* p < 0.05, ** p < 0.01, *** p < 0.001, ns. No significant difference). The data are analyzed using ANOVA and presented as mean value ± SD.
Figure 8
Figure 8
miR‐5107‐5p in EPO‐EVs alleviates inflammatory bone loss in vivo through EGFR/RhoA axis. A) Schematic diagram of the ligature‐induced periodontitis mice model and the time point of local periodontal injection. B) 3D reconstruction of the maxillary samples in each group by micro‐CT scan. The red double arrows extend from the CEJ to the apex of the ABC. Scale bar = 1 mm. C) Quantification analysis of the distance from CEJ to ABC in each group as determined by micro‐CT (n = 5) (* p < 0.05, ** p < 0.01, *** p < 0.001, ns. No significant difference). The data are analyzed using ANOVA and presented as mean value ± SD. D) Quantitative analysis of BV/TV, Tb. Th, Tb. N and Tb. Sp. (n = 5) (* p < 0.05, ** p < 0.01, *** p < 0.001, ns. No significant difference). The data are analyzed using ANOVA and presented as mean value ± SD. E) Histological H&E staining of the periodontium in each group. The vertical lines extend from the CEJ to the ABC. Scale bar = 100 µm. F) Quantification analysis of the distance from CEJ to ABC in each group as determined by H&E staining (n = 5) (* p < 0.05, ** p < 0.01, *** p < 0.001, ns. No significant difference). The data are analyzed using ANOVA and presented as mean value ± SD. G) Immunofluorescence staining showed the expression of EGFR in the periodontium of each group. Nuclei were stained with DAPI. Scale bar = 100 µm; Scale bar (Zoom) = 20 µm. H) Statistical analysis of the IF staining of periodontal EGFR+ cells in each group (n = 5). The number of EGFR+ cells was quantified for each microscope field of view (* p < 0.05, ** p < 0.01, *** p < 0.001, ns. No significant difference). The data are analyzed using ANOVA and presented as mean value ± SD. I) Immunofluorescence staining showed the expression of RhoA in the periodontium of each group. Nuclei were stained with DAPI. Scale bar = 100 µm; Scale bar (Zoom) = 20 µm. J) Statistical analysis of the IF staining of periodontal RhoA+ cells in each group (n = 5). The number of RhoA+ cells was quantified for each microscope field of view (* p < 0.05, ** p < 0.01, *** p < 0.001, ns. No significant difference). The data are analyzed using ANOVA and presented as mean value ± SD.

Similar articles

References

    1. Kinane D. F., Stathopoulou P. G., Papapanou P. N., Nat. Rev. Dis. Primers 2017, 3, 17038. - PubMed
    1. Genco R. J., Sanz M., Periodontol. 2000 2020, 83, 7. - PubMed
    1. Marruganti C., Suvan J. E., D'Aiuto F., Periodontol. 2000 2023, 83, 7. - PubMed
    1. Laforgia A., Inchingolo A. D., Piras F., Colonna V., Giorgio R. V., Carone C., Rapone B., Malcangi G., Inchingolo A. M., Inchingolo F., Int. J. Mol. Sci. 2024, 25, 7217. - PMC - PubMed
    1. Sgolastra F., Petrucci A., Ciarrocchi I., Masci C., Spadaro A., J. Periodontol. Res. 2021, 56, 236. - PubMed

LinkOut - more resources