. 2025 Mar 10;17(6):961.
doi: 10.3390/nu17060961.

Dietary Polyunsaturated Fatty Acid Deficiency Impairs Renal Lipid Metabolism and Adaptive Response to Proteinuria in Murine Renal Tubules

Affiliations

Dietary Polyunsaturated Fatty Acid Deficiency Impairs Renal Lipid Metabolism and Adaptive Response to Proteinuria in Murine Renal Tubules

Yaping Wang et al. Nutrients. .

Abstract

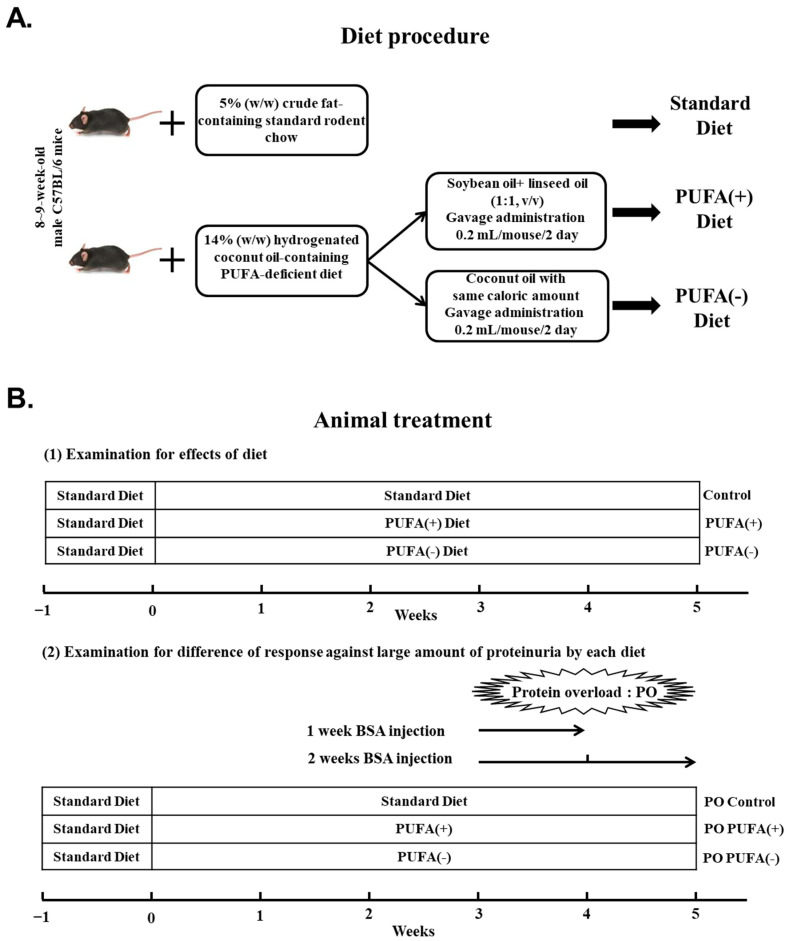
Background/Objectives: Kidneys are fatty acid (FA)-consuming organs that use adenosine triphosphate (ATP) for tubular functions, including endocytosis for protein reabsorption to prevent urinary protein loss. Peroxisome proliferator-activated receptor α (PPARα) is a master regulator of FA metabolism and energy production, with high renal expression. Although polyunsaturated fatty acids (PUFAs) are essential nutrients that are natural PPARα ligands, their role in tubular protein reabsorption remains unclear. As clinical PUFA deficiency occurs in humans under various conditions, we used a mouse model that mimics these conditions. Methods: We administered a 2-week intraperitoneal protein-overload (PO) treatment to mice that had been continuously fed a PUFA-deficient diet. We compared the phenotypic changes with those in mice fed a standard diet and those in mice fed a PUFA-deficient diet with PUFA supplementation. Results: In the absence of PO, the PUFA-deficient diet induced increased lysosomal autophagy activation; however, other phenotypic differences were not detected among the diet groups. In the PO experimental condition, the PUFA-deficient diet increased daily urinary protein excretion and tubular lysosomes; suppressed adaptive endocytosis activation, which was probably enhanced by continuous autophagy activation; and worsened FA metabolism and PPARα-mediated responses to PO, which disrupted renal energy homeostasis. However, these changes were attenuated by PUFA supplementation at the physiological intake level. Conclusions: PUFAs are essential nutrients for the tubular adaptive reabsorption response against urinary protein loss. Therefore, active PUFA intake may be important for patients with kidney disease-associated proteinuria, especially those with various PUFA deficiency-inducing conditions.

Keywords: PPARα; fatty acid metabolism; kidney function; lysosome; tubular protein reabsorption.


Conflict of interest statement

The authors declare no conflicts of interest.

Figures

Figure 1
Figure 1
Dietary procedure and treatment of mice. (A) After the 1-week acclimatization, the control group was fed a 5% (w/w) crude fat-containing standard diet continuously, whereas the other diet groups were switched to a 14% (w/w) hydrogenated coconut oil (HCO)-containing polyunsaturated fatty acid (PUFA)-deficient diet for 5 weeks. The PUFA (+) diet group, in addition to the PUFA-deficient diet, was orally treated with PUFA-containing oil at a physiological level. To ensure equal calorie intake, the PUFA (−) diet group was orally administered the PUFA-deficient oil with the same caloric content. (B) (1) Examination of the effects of diet. After the 1-week acclimatization, the mice were randomly divided into the control (standard diet: n = 4), PUFA (+) diet (PUFA supplementation on PUFA-deficient diet: n = 4), and PUFA (−) diet (continuous PUFA-deficient diet: n = 4) groups. (2) Examination for differences in the responses to excessive protein overload (PO) in each dietary group. These mice received PO treatment from the third week after the initiation of the specific diet. These mice received daily intraperitoneal injections of bovine serum albumin solution for 1 week [1w PO control, 1w PO PUFA (+), and 1w PO PUFA (−)] or 2 weeks [2w PO control, 2w PO PUFA (+), and 2w PO PUFA (−)] (each group, n = 5).
Figure 2
Figure 2
Diet-stratified differences in daily urinary protein excretion in protein overload (PO) mice. Daily total urinary protein excretion in each mouse group (mg/mouse/day) was compared. Black line, control (standard diet without PO); red line, PO control (standard diet with PO); green line, PO PUFA (+); blue line, PO PUFA (−) groups. Data are expressed as the mean ± SD. Statistically significant differences: # p < 0.05, ## p < 0.01, and ### p < 0.001 vs. the PO control group.
Figure 3
Figure 3
Pathological analyses of kidney tissues. (A) Light microscopic analysis. The kidney tissue sections were stained with periodic acid–methenamine silver (PAM). The scale bars in the left panels and the middle panels represent 100 and 50 μm, respectively. The right panels show enlarged images of the square area in the middle panels. (B) Pathological analyses for glomeruli. Representative glomeruli from each group are shown. The right panels show enlarged images of the square areas in the left panels.
Figure 4
Figure 4
Immunofluorescence staining of lysosomal membrane marker, Lamp1, in the renal cortex. Confocal images of kidney samples obtained from each group. Lamp1 was visualized using a FITC-conjugated secondary antibody (green), followed by counterstaining with DAPI (blue). Scale bar = 50 μm.
Figure 5
Figure 5
Transmission electron microscopy (TEM) analyses of kidney tissues. (A) Representative electron micrographs of sections containing proximal tubules. The number of lysosomes counted in 30 random TEM images of each mice group are indicated. Scale bar = 5 μm. Data are expressed as the mean ± SD. Statistically significant differences: ## p < 0.01 vs. the 2w PO control group. (B) TEM analysis under high magnification in the 2w PO PUFA (−) group. (af) Lysosomes containing various components were observed. Scale bar = 2.5 μm.
Figure 6
Figure 6
Renal expression of autophagic and lysosomal related enzymes. (A) mRNA expression of the autophagy-related protein Beclin1, lysosomal marker Lamp1, and representative lysosomal enzyme β-glucuronidase in each mouse group. The mRNA levels of these enzymes were analyzed via real-time PCR and normalized to that of GAPDH. (B) Protein expression of autophagy marker LC3B, autophagy-related proteins Atg5 and Beclin1, and autophagy substrate P62. The protein levels were normalized to that of β-actin. All the data are shown as fold changes relative to the control group. Data are expressed as the mean ± SD. The white, gray, and black bars indicate the control, PUFA (+), and PUFA (−) groups, respectively. Statistically significant differences: * p < 0.05, ** p < 0.01, and *** p < 0.001 vs. the control group; # p < 0.05, ## p < 0.01, and ### p < 0.001 vs. the 2w PO control group.
Figure 7
Figure 7
Renal mRNA expression of major enzymes in the mitochondrial and peroxisomal β-oxidation system. CPT II acts on fatty acid transport from the cytosol to mitochondria. VLCAD, TPα, and TPβ catalyze the β-oxidation reaction of long-chain fatty acids. PH and PT are mainly responsible for the dehydration, dehydrogenation, and sulfidation processes in peroxisomes. The mRNA levels of these enzymes were analyzed via real-time PCR and normalized to those of GAPDH. All the data are shown as fold changes relative to the control group and expressed as the mean ± SD. The white, gray, and black bars indicate the control, PUFA (+), and PUFA (−) groups, respectively. Statistically significant differences: ** p < 0.01 and *** p < 0.001 vs. the control group; §§ p < 0.01 and §§§ p < 0.001 vs. the 1w PO control group; # p < 0.05, ## p < 0.01, and ### p < 0.001 vs. the 2w PO control group.
Figure 8
Figure 8
Immunoblot analyses of fatty acid β-oxidation-metabolizing enzymes in the renal cortex. Immunoblot analyses showing the protein expression levels of the mitochondrial β-oxidation enzymes (LACS, VLCAD, LCAD, MCAD, TPα, and TPβ), peroxisomal β-oxidation enzymes (AOX1, PH, and PT), and CPT II. The protein levels were normalized to that of β-actin. All the data are shown as fold changes relative to the control mice. Data are expressed as the mean ± SD. White, gray, and black bars indicate control, PUFA (+), and PUFA (−) groups, respectively. Statistically significant differences: * p < 0.05, ** p < 0.01, and *** p < 0.001 vs. the control group; # p < 0.05, ## p < 0.01, and ### p < 0.001 vs. the 2w PO control group.
Figure 9
Figure 9
Effects of polyunsaturated fatty acid (PUFA)-deficient diet on peroxisome proliferator-activated receptor α (PPARα) DNA-binding activity and ATP level in the renal cortex. (A) The DNA-binding activity of PPARα in the kidney cortex. The data are shown as fold changes relative to the control mice. (B) The ATP level in the kidney cortex. All data are expressed as the mean ± SD. White, gray, and black bars indicate control, PUFA (+), and PUFA (−) groups, respectively. Statistically significant differences: * p < 0.05, ** p < 0.01, and *** p < 0.001 vs. the control group; ## p < 0.01 vs. the 2w PO control group.
Figure 10
Figure 10
Schematic representation of the speculated mechanism explaining the observed phenomena and importance of polyunsaturated fatty acids (PUFAs) for urinary protein reabsorption in proximal tubular epithelial cells (PTECs) during protein overload (PO). (A) Normal intake of PUFAs. (B) PUFA-deficient status. Red X means impairment of function.

Similar articles

References

    1. Shi M.Y., Yu H.C., Han C.Y., Bang I.H., Park H.S., Jang K.Y., Lee S., Son J.B., Kim N.D., Park B.H., et al. p21-activated kinase 4 suppresses fatty acid beta-oxidation and ketogenesis by phosphorylating NCoR1. Nat. Commun. 2023;14:4987. doi: 10.1038/s41467-023-40597-z. - DOI - PMC - PubMed
    1. Tahri-Joutey M., Andreoletti P., Surapureddi S., Nasser B., Cherkaoui-Malki M., Latruffe N. Mechanisms mediating the regulation of peroxisomal fatty acid beta-oxidation by PPARα. Int. J. Mol. Sci. 2021;22:8969. doi: 10.3390/ijms22168969. - DOI - PMC - PubMed
    1. Liao J., Xie X., Wang N., Wang Y., Zhao J., Chen F., Qu F., Wen W., Miao J., Cui H. Formononetin promotes fatty acid beta-oxidation to treat non-alcoholic steatohepatitis through SIRT1/PGC-1alpha/PPARalpha pathway. Phytomedicine. 2024;124:155285. doi: 10.1016/j.phymed.2023.155285. - DOI - PubMed
    1. Fan S., Gao Y., Qu A., Jiang Y., Li H., Xie G., Yao X., Yang X., Zhu S., Yagai T., et al. YAP-TEAD mediates PPAR alpha-induced hepatomegaly and liver regeneration in mice. Hepatology. 2022;75:74–88. doi: 10.1002/hep.32105. - DOI - PMC - PubMed
    1. Xie S.Y., Liu S.Q., Zhang T., Shi W.K., Xing Y., Fang W.X., Zhang M., Chen M.Y., Xu S.C., Fan M.Q., et al. USP28 serves as a key suppressor of mitochondrial morphofunctional defects and cardiac dysfunction in the diabetic heart. Circulation. 2024;149:684–706. doi: 10.1161/CIRCULATIONAHA.123.065603. - DOI - PubMed

LinkOut - more resources