. 2025 Apr 25:8:0676.
doi: 10.34133/research.0676. eCollection 2025.

Low-Intensity Pulsed Ultrasound Promotes Oligodendrocyte Maturation and Remyelination by Down-regulating the Interleukin-17A/Notch1 Signaling Pathway in Mice with Ischemic Stroke

Affiliations

Low-Intensity Pulsed Ultrasound Promotes Oligodendrocyte Maturation and Remyelination by Down-regulating the Interleukin-17A/Notch1 Signaling Pathway in Mice with Ischemic Stroke

Jingjing Wang et al. Research (Wash D C). .

Abstract

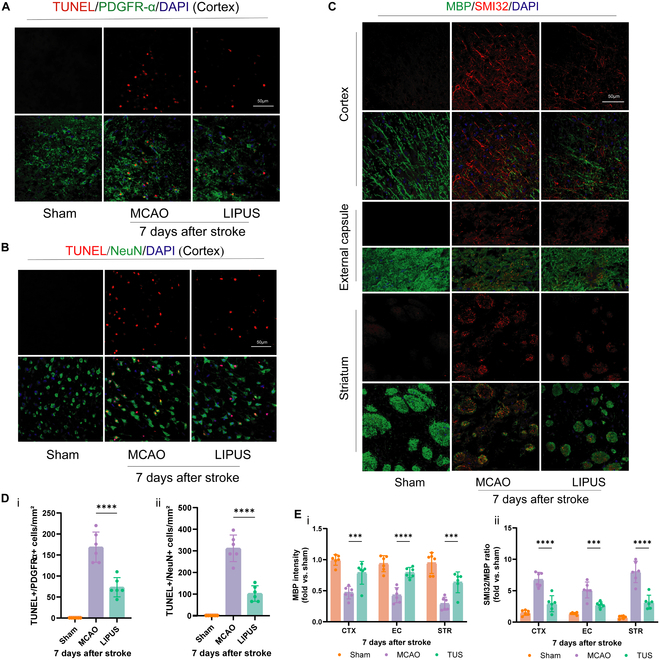
Increasing evidence indicates that oligodendrocyte (OL) numbers and myelin as a dynamic cellular compartment perform a key role in the maintenance of neuronal function. Inhibiting white matter (WM) demyelination or promoting remyelination has garnered interest for its potential therapeutic strategy against ischemic stroke. Our previous work has shown that low-intensity pulsed ultrasound (LIPUS) could improve stroke recovery. However, it is unclear whether LIPUS can maintain WM integrity early after stroke or promote late WM repair. This study evaluated the efficacy of LIPUS on WM repair and long-term neurologic recovery after stroke. Male adult C57BL/6 mice underwent a focal cerebral ischemia model and were randomized to receive ultrasound stimulation (30 min once daily for 14 days). The effect of LIPUS on sensorimotor function was assessed by modified neurological severity score, rotarod test, grip strength test, and gait analysis up to 28 days after stroke. We found that ischemic stroke-induced WM damage was severe on day 7 and partially recovered on day 28. LIPUS prevented neuronal and oligodendrocyte progenitor cell (OPC) death during the acute phase of stroke (d7), protected WM integrity, and reduced brain atrophy and tissue damage during the recovery phase (d28). To further confirm the effect of LIPUS on remyelination, we assessed the proliferation and differentiation of OPCs. We found that LIPUS did not increase the number of OPCs (PDGFRα+ or NG2+), but markedly increased the number of newly produced mature OLs (APC+) and myelin protein levels. Mechanistically, LIPUS may promote OL maturation and remyelination by down-regulating the interleukin-17A/Notch1 signaling pathway. In summary, LIPUS can protect OLs and neurons early after stroke and promote long-term WM repair and functional recovery. LIPUS will be a viable strategy for the treatment of ischemic stroke in the future.


Conflict of interest statement

Competing interests: The authors declare that they have no competing interests.

Figures

Fig. 1.
Fig. 1.
LIPUS improves long-term histologic and functional prognosis after ischemic stroke. (A) Design of the experimental program for this study. (B) Representative images (i) and quantitative analysis plots (ii) of cortical width index on day 28 after stroke, n = 4 mice/group. (C to F) Quantitative analysis of mean velocity (C), rotarod test (D), neurological score (E), and left forepaw strength (F) before (baseline) and after dMCAO (days 1, 3, 7, 14, 21, and 28), n = 10 mice/group. (G) Representative images of TTC staining (i) and quantitative analysis of infarct volume (ii), n = 6 mice/group. (H) Representative images of CBF at baseline, at the time of ischemia, and on day 7 after dMCAO (i), and quantification of cerebral blood flow on postoperative day 7 (ii), n = 6 mice/group. The above data are expressed as mean ± SD. The data in (C) to (F) were subjected to repeated-measures ANOVA, while the analysis of (B) and (G) involved an unpaired 2-tailed Student’s t test. Additionally, for (H), a one-way ANOVA was conducted followed by Tukey’s multiple comparisons test. *P < 0.05, **P < 0.01, ***P < 0.001,****P < 0.0001.
Fig. 2.
Fig. 2.
LIPUS improves cerebral WM integrity on day 28 after stroke. (A) Schematic of the localization of the peri-infarct cortex (CTX), external capsule (EC), and striatum (STR). (B) Double-labeled immunofluorescence staining of MBP (green) and SMI32 (red) in 3 brain regions, CTX, EC, and STR, on day 28 after dMCAO (i). Quantification of MBP immunoreactivity (ii) and the SMI32/MBP fluorescence intensity ratio (iii) are presented as the ratio of fold change compared to the Sham control, scale bar = 50 μm, n = 6 mice/group. (C) Representative images depicting that the Western blot analysis of MBPs was obtained for each group (i). The expression levels of the target proteins were normalized relative to β-actin (ii). (D) Representative immunostaining of MBP and SMI32 on day 28 after dMCAO (i), scale bar = 200 μm; (ii) quantification of the ratio of MBP to SMI32 staining-positive areas in ipsilateral injured brain tissue. Data were normalized to stained areas in the contralateral hemisphere, n = 6 mice/group. (E) Representative images of myelin coverage (i), calculated MBP+ myelin coverage area along NF200+ nerve fibers (ii), scale bar = 20 μm, n = 6 mice/group. Data are presented as means ± SD. Statistical analysis for (B) was conducted using 2-way ANOVA and then Tukey’s multiple comparisons test, while (C) and (E) were analyzed using one-way ANOVA and then Tukey’s multiple comparisons test. Analysis for (D) involved unpaired 2-tailed Student’s t test. *P < 0.05, **P < 0.01, ***P < 0.001,****P < 0.0001.
Fig. 3.
Fig. 3.
LIPUS reduces early death of neurons and OPCs and improves WM integrity after ischemic stroke. Representative images (A) and quantitative analysis (D, i) of TUNEL (a marker of cell death) and PDGFR-α (a marker of OPC) immunostaining in the peri-infarct cortex on day 7 after stroke. Representative images (B) and quantitative analysis (D, ii) of TUNEL and NeuN (a marker of neurons) immunostaining in the peri-infarct cortex on day 7 after stroke. Representative images (C) of double-labeled immunofluorescence staining for MBP and SMI32 in 3 brain regions (CTX, EC, and STR) on day 7 after dMCAO. Quantification of MBP immunoreactivity (E, i) and SMI32/MBP fluorescence intensity ratio (E, ii) is indicated as fold change relative to Sham control. Scale bar = 50 μm, n = 6 mice/group. Data are presented as means ± SD. (A) was analyzed using a 2-way ANOVA followed by Tukey’s post hoc test, while (B) and (C) were assessed using a one-way ANOVA followed by Tukey’s post hoc analysis. ***P < 0.001, ****P < 0.0001.
Fig. 4.
Fig. 4.
LIPUS has a nonsignificant influence on OPC proliferation after ischemic stroke. (A) and (B) depict immunostaining results of BrdU (a marker for cell proliferation, shown in red) along with 2 OPC markers PDGFR-α and NG2 (shown in green), observed in 3 brain regions on day 14 post-stroke. (C) and (D) are quantitative analyses of (A) and (B), counting the number of Brdu+PDGFR-α (C, i), PDGFR-α+ cells (C, ii), Brdu+NG2+ cells (D, i), and NG2+ cells (D, ii). Scale bar = 50 μm, n = 6 mice/group. Data are presented as means ± SD. The statistical analysis of (C) and (D) involved conducting a 2-way ANOVA and subsequently applying Tukey’s multiple comparisons test. *P < 0.05, **P < 0.01. ns = no statistical difference.
Fig. 5.
Fig. 5.
LIPUS promotes the production of newly matured OLs after ischemic stroke. (A) Quantification of newborn OLs in the peri-infarct region (CTX, EC, and STR) on day 14 after stroke. (i) Representative images showing the colocalization of APC (green) and BrdU (red) through double immunofluorescence staining, (ii) statistical analysis depicting the quantity of BrdU+APC+ cells, and (iii) statistical analysis illustrating the overall number of APC+ cells. Scale bar = 50 μm, n = 6 mice/group. (B) Representative images depicting that the Western blot analysis of APC protein expression levels in the peri-infarct brain region was obtained at postoperative day 14 (i). The expression levels of the target proteins were normalized relative to β-actin (ii), n = 6 mice/group. (C, i) RT-qPCR was performed to detect the expression of OL differentiation-related transcription factors (Olig2, Sox10, and Bcas1) and (C, ii) myelin-related genes (Plp, Mog, CNPase, and Mbp). The experiment was repeated 3 to 5 times. The obtained results were first standardized against glyceraldehyde-3-phosphate dehydrogenase (GAPDH) and subsequently normalized with respect to the control group (MCAO group), n = 6 mice/group. Data are presented as means ± SD. Statistical analysis was conducted using 2-way ANOVA followed by Tukey’s multiple comparisons test for (A) and (C), and one-way ANOVA followed by Tukey’s multiple comparisons test for (B). *P < 0.05, **P < 0.01, ***P < 0.001, ****P < 0.0001, ns = no statistical difference.
Fig. 6.
Fig. 6.
LIPUS down-regulates IL-17A expression and Notch1 activation after ischemic stroke. (A to C) RNA-seq analysis was performed on ischemic penumbra brain tissue from dMCAO nonintervention and LIPUS-treated mice at postoperative day 14, n = 4 mice/group. (A) The results of hierarchical cluster analysis for differential genes between the 2 groups were displayed using a heatmap. (B) A volcano plot was employed to visualize the changes in gene expression (up-regulation in red and down-regulation in blue) detected by RNA-seq between LIPUS-treated mice and nonintervention MCAO mice. (C) KEGG pathway analysis revealed alterations in several important pathways within the ischemic penumbral brain tissue following LIPUS intervention. (D) Differences in IL-17A protein levels within the peri-infarct brain regions of Sham, MCAO, and LIPUS group mice are shown with representative images in (i) and quantitative plots in (i). β-Actin serves as a loading control. n = 6 mice/group. (E) Expression of IL-17A in brain tissue homogenates from 3 groups of mice by ELISA. n = 6 mice/group. (F) Representative maps of double immunofluorescence staining for Notch1 (red) and PDGFR-α (green) in peri-infarct cortex. (G) RT-qPCR detection of Notch1 expression. Experiments were repeated 3 to 5 times. n = 6 mice/group. (H) Western blot analysis of protein levels of Notch1 and its activated state (Cleaved-Notch1) in semi-dark band brain tissues. (i) Representative images and (ii and iii) quantitative statistical plots. n = 6 mice/group. Data are reported as means ± SD. Statistical analysis for comparisons between groups (D, E, and H) was conducted using one-way ANOVA followed by Tukey’s multiple comparisons test, while an unpaired 2-tailed Student’s t test was employed for the analysis of group (G). *P < 0.05, **P < 0.01, * *P < 0.001, ns = no statistical difference.
Fig. 7.
Fig. 7.
LIPUS promotes differentiation of OPCs and improves cerebral WM integrity after ischemic stroke by inhibiting the IL-17A/Notch1 pathway. (A) Western blot analysis of the protein levels of IL-17A in 4 groups of penumbra brain tissues, with representative images (i) and quantitative analysis plots (ii), n = 6 mice/group. (B) Western blot analysis of the protein levels of Notch1 and Cleaved-Notch1 in 4 groups of penumbra brain tissues, with representative images (i) and quantitative analysis plots of Notch1 (ii) and Cleaved-Notch1 (iii), n = 6 mice/group. (C) Representative photographs of TTC staining (i) and quantitative analysis of infarct volume (ii), n = 6 mice/group. (D) Representative images depicting that the Western blot analysis of MBP was obtained for each group (i). The expression levels of the target proteins were normalized relative to β-actin (ii), n = 6 mice/group. (E) Representative images depicting that the Western blot analysis of APC was obtained for each group (i). The expression levels of the target proteins were normalized relative to β-actin (ii), n = 6 mice/group. (F) Double-labeled immunofluorescence staining of MBP (green) and SMI32 (red) in 3 brain regions, CTX, EC, and STR, scale bar = 50μm, n = 6 mice/group. (G) is the quantification of MBP immunoreactivity in (F), and (H) is the SMI32/MBP intensity ratio in (F). (J) Representative images showing the colocalization of APC (green) and BrdU (red) through double immunofluorescence staining, scale bar = 50μm, n = 6 mice/group. (I) is a quantitative map of Brdu+APC+ cells in (J). Data are presented as means ± SD, (A) to (E) were performed by one-way ANOVA followed by Tukey’s multiple comparisons test. (G) to (I) were performed by a 2-way ANOVA followed by Tukey’s multiple comparisons test.*P < 0.05, **P < 0.01, ***P < 0.001, ****P < 0.0001, ns = no statistical difference.

Similar articles

References

    1. Sampaio-Baptista C, Johansen-Berg H. White matter plasticity in the adult brain. Neuron. 2017;96(6):1239–1251. - PMC - PubMed
    1. Kissela B, Lindsell CJ, Kleindorfer D, Alwell K, Moomaw CJ, Woo D, Flaherty ML, Air E, Broderick J, Tsevat J. Clinical prediction of functional outcome after ischemic stroke: The surprising importance of periventricular white matter disease and race. Stroke. 2009;40(2):530–536. - PMC - PubMed
    1. Xiao Y, Czopka T. Myelination-independent functions of oligodendrocyte precursor cells in health and disease. Nat Neurosci. 2023;26(10):1663–1669. - PubMed
    1. Bergles DE, Richardson WD. Oligodendrocyte development and plasticity. Cold Spring Harb Perspect Biol. 2015;8(2): Article a020453. - PMC - PubMed
    1. Guo F, Wang Y. TCF7l2, a nuclear marker that labels premyelinating oligodendrocytes and promotes oligodendroglial lineage progression. Glia. 2022;71(2):143–154. - PMC - PubMed

LinkOut - more resources