

Coordinated regulation of IGF1R by HIF1α and HIF2α enhances chemoresistance in glioblastoma
- PMID: 40290443
- PMCID: PMC12021886
- DOI: 10.3389/fphar.2025.1575332
Coordinated regulation of IGF1R by HIF1α and HIF2α enhances chemoresistance in glioblastoma
Abstract
Background: This study investigates whether Hypoxia-Inducible Factor 1 alpha (HIF1α) and Hypoxia-Inducible Factor 2 alpha (HIF2α) coordinately regulate insulin-like growth factor 1 receptor (IGF1R) expression, thereby influencing chemosensitivity in glioblastoma multiforme (GBM).
Methods: We analyzed the expression and correlation of HIF1α, HIF2α, and IGF1R in glioma using The Cancer Genome Atlas (TCGA) and Chinese Glioma Genome Atlas (CGGA) databases. Immunohistochemistry (IHC) was performed to detect the expression of HIF1α, HIF2α, and IGF1R in GBM tissues and cells, as well as oxygen tension. Cell cycle analysis, apoptosis assays, lactate dehydrogenase (LDH) release measurements, Western blotting, and xenograft tumor models were employed to explore the synergistic regulation of IGF1R by HIF1α and HIF2α, focusing on activation of the PI3K/AKT signaling pathway and its contribution to GBM drug resistance. Chromatin immunoprecipitation-quantitative PCR (ChIP-qPCR) and dual-luciferase reporter assays were used to investigate the binding sites of HIF1α and HIF2α involved in regulating IGF1R.
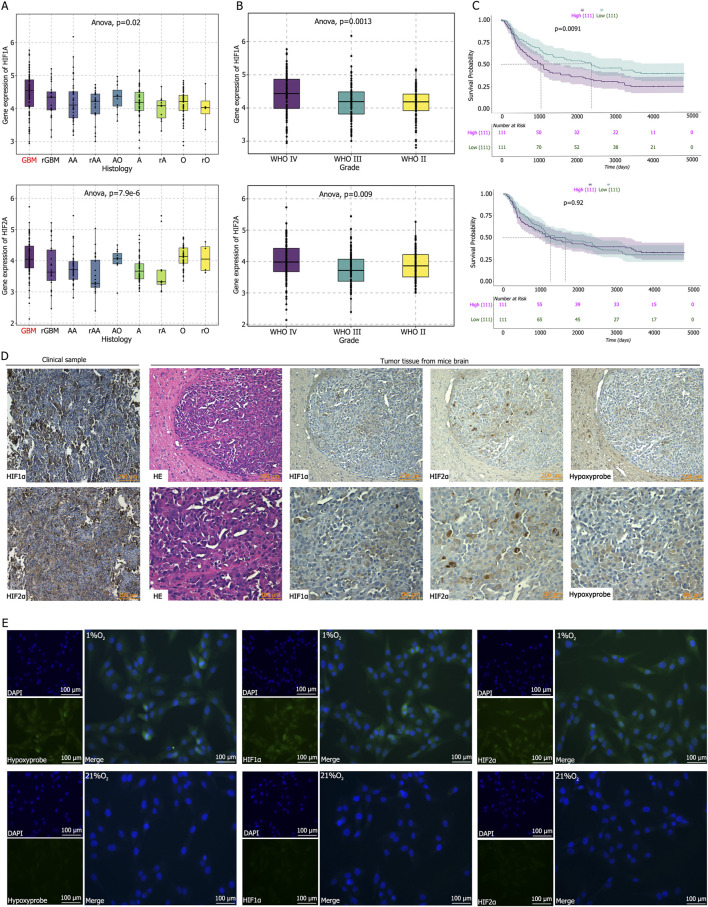
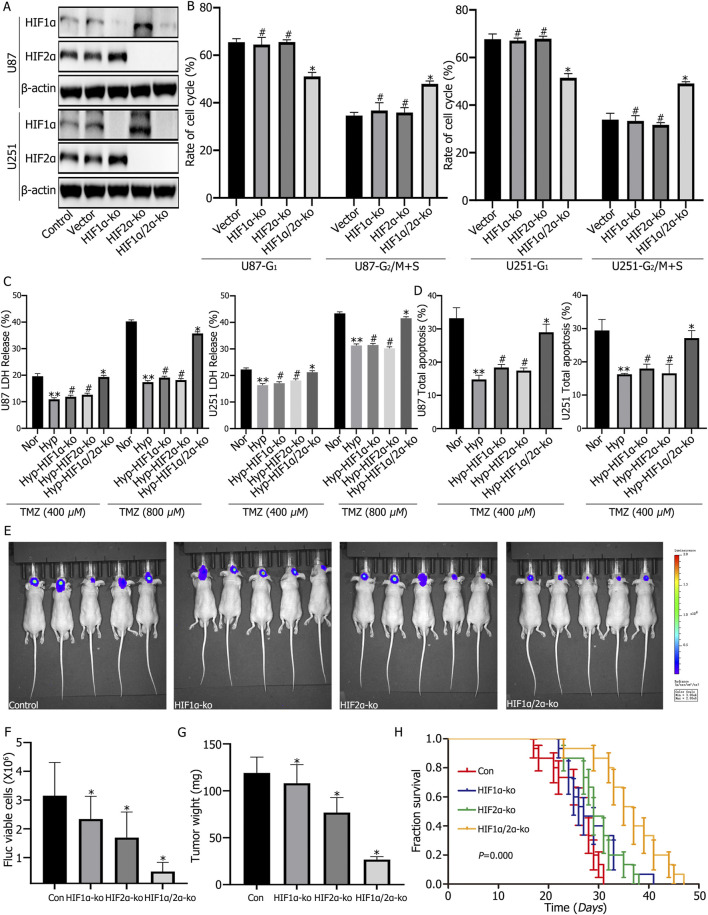
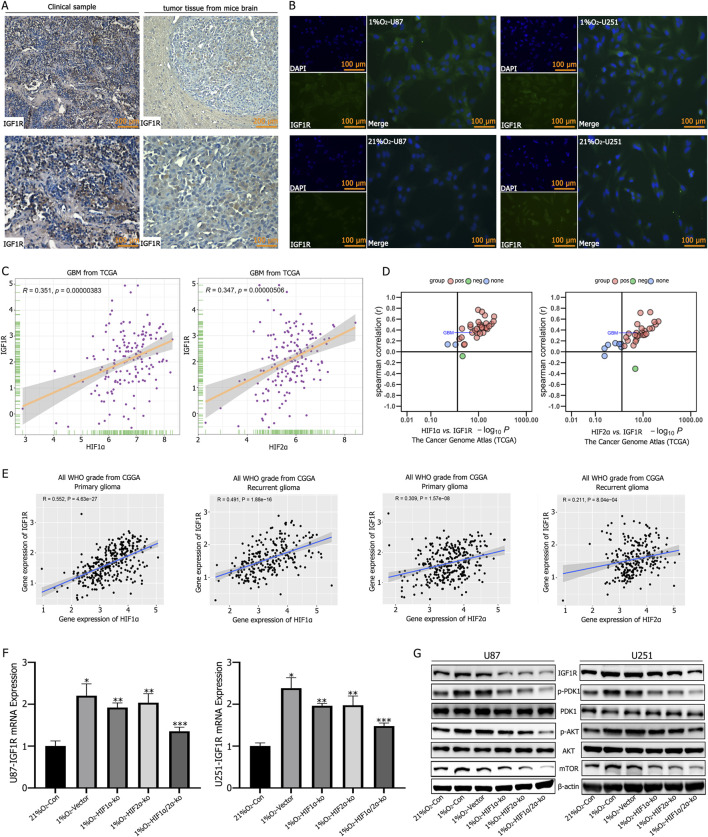
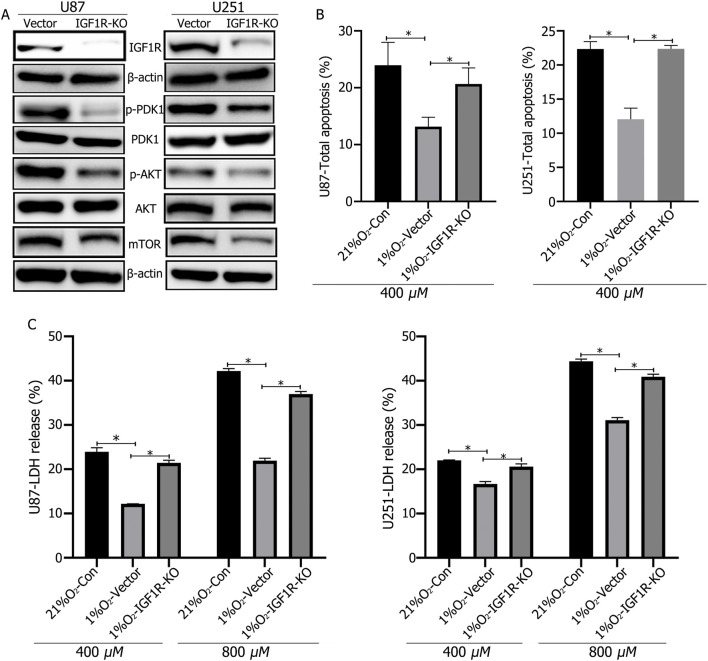
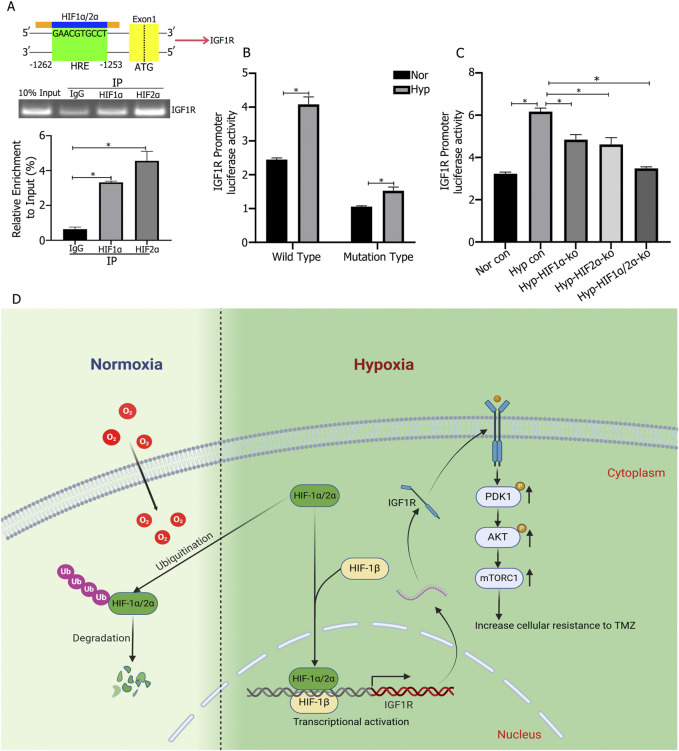
Results: Our study demonstrated that HIF1α and HIF2α were highly expressed in GBM tissues and hypoxia-cultured cells, and their expression positively correlated with IGF1R expression. Simultaneous knockout of HIF1α and HIF2α in GBM cells resulted in the highest LDH release and apoptosis rates under hypoxic conditions, accompanied by the most significant decrease in IGF1R, p-PDK1, and p-AKT levels. Knockout of IGF1R in tumor cells under hypoxia led to an increas of LDH release and apoptosis rates, and reduced phosphorylation of PDK1 and AKT. In addition, we demonstrated that HIF1α and HIF2α promoted IGF1R expression by binding to a specific hypoxia response element (HRE) sequence (5'-GAACGTGCCT-3') within the IGF1R promoter using dual-luciferase reporter system.
Conclusion: Glioblastoma cells, residing within a hypoxic microenvironment, exhibit high expression of HIF1α and HIF2α. These transcription factors promote the upregulation of IGF1R, which subsequently activates the PI3K/AKT signaling pathway. This activation, in turn, promotes cell proliferation and chemoresistance, ultimately contributing to tumor malignancy.
Keywords: HIF1α; HIF2α; IGF1R; chemoresistance; glioblastoma multiforme; hypoxic microenvironment; temozolomide.
Copyright © 2025 Liao, Wang, Gong, Zhao, Liu and Wu.
Conflict of interest statement
The authors declare that the research was conducted in the absence of any commercial or financial relationships that could be construed as a potential conflict of interest.
Figures
Similar articles
-
HIF1α/HIF2α-Sox2/Klf4 promotes the malignant progression of glioblastoma via the EGFR-PI3K/AKT signalling pathway with positive feedback under hypoxia.Cell Death Dis. 2021 Mar 24;12(4):312. doi: 10.1038/s41419-021-03598-8. Cell Death Dis. 2021. PMID: 33762574 Free PMC article.
-
The HIF1α/HIF2α-miR210-3p network regulates glioblastoma cell proliferation, dedifferentiation and chemoresistance through EGF under hypoxic conditions.Cell Death Dis. 2020 Nov 18;11(11):992. doi: 10.1038/s41419-020-03150-0. Cell Death Dis. 2020. PMID: 33208727 Free PMC article.
-
HIF1α/HIF2α induces glioma cell dedifferentiation into cancer stem cells through Sox2 under hypoxic conditions.J Cancer. 2022 Jan 1;13(1):1-14. doi: 10.7150/jca.54402. eCollection 2022. J Cancer. 2022. PMID: 34976166 Free PMC article.
-
Drug resistance and cancer stem cells: the shared but distinct roles of hypoxia-inducible factors HIF1α and HIF2α.Clin Exp Pharmacol Physiol. 2017 Feb;44(2):153-161. doi: 10.1111/1440-1681.12693. Clin Exp Pharmacol Physiol. 2017. PMID: 27809360 Review.
-
The role of hypoxia-inducible factors in metabolic diseases.Nat Rev Endocrinol. 2018 Dec;15(1):21-32. doi: 10.1038/s41574-018-0096-z. Nat Rev Endocrinol. 2018. PMID: 30275460 Free PMC article. Review.
References
-
- Courtney K. D., Infante J. R., Lam E. T., Figlin R. A., Rini B. I., Brugarolas J., et al. (2018). Phase I dose-Escalation trial of PT2385, a First-in-Class hypoxia-inducible factor-2α antagonist in patients with previously treated advanced clear cell renal cell carcinoma. J. Clin. Oncol. Off. J. Am. Soc. Clin. Oncol. 36, 867–874. 10.1200/JCO.2017.74.2627 - DOI - PMC - PubMed
-
- Flanigan S. A., Pitts T. M., Newton T. P., Kulikowski G. N., Tan A. C., McManus M. C., et al. (2013). Overcoming IGF1R/IR resistance through inhibition of MEK signaling in colorectal cancer models. Clin. Cancer Res. Off. J. Am. Assoc. Cancer Res. 19, 6219–6229. 10.1158/1078-0432.CCR-13-0145 - DOI - PMC - PubMed
LinkOut - more resources
Full Text Sources
Miscellaneous