Identification of cellular senescence-related genes as biomarkers for lupus nephritis based on bioinformatics
- PMID: 40290492
- PMCID: PMC12021929
- DOI: 10.3389/fgene.2025.1551450
Identification of cellular senescence-related genes as biomarkers for lupus nephritis based on bioinformatics
Abstract
Background: Lupus nephritis (LN) is one of the most common and severe complications of systemic lupus erythematosus with unclear pathogenesis. The most accurate diagnosis criterion of LN is still renal biopsy and nowadays treatment strategies of LN are far from satisfactory. Cellular senescence is defined as the permanent cell cycle arrest marked by senescence-associated secretory phenotype (SASP), which has been proved to accelerate the mobility and mortality of patients with LN. The study is aimed to identify cellular senescence-related genes for LN.
Methods: Genes related to cellular senescence and LN were obtained from the MSigDB genetic database and GEO database respectively. Through differential gene analysis, Weighted Gene Go-expression Network Analysis (WGCNA) and machine learning algorithms, hub cellular senescence-related differentially expressed genes (CS-DEGs) were identified. By external validation, hub CS-DEGs were further filtered and the remaining genes were identified as biomarkers. We explored their potential physiopathologic function through GSEA.
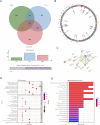
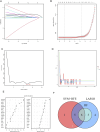
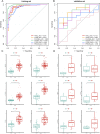
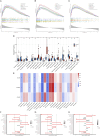
Results: We obtained 432 genes related to cellular senescence, 1,208 differentially expressed genes (DEGs) and 840 genes in the key gene module related to LN, which were intersected with each other for CS-DEGs. Subsequent Machine learning algorithms screened out six hub CS-DEGs and finally three hub CS-DEGs, ALOX5, PTGER2 and PRKCB passed through external validation, which were identified as biomarkers. The three biomarkers were enriched in "B Cell receptor signaling pathway" and "NF-kappa B signaling pathway" based on GESA results.
Conclusion: This study explored the potential relationship between cellular senescence and LN, and identified three biomarkers ALOX5, PTGER2, and PRKCB playing key roles in LN, which will provide new insights for the diagnosis and treatment of LN.
Keywords: biomarker; cellular senescence; lupus nephritis; machine learning; weighted gene Co-expression network (WGCNA).
Copyright © 2025 Chen, Wang, Huang, Sheng and Zhou.
Conflict of interest statement
The authors declare that the research was conducted in the absence of any commercial or financial relationships that could be construed as a potential conflict of interest.
Figures


Similar articles
-
Identification of driver genes in lupus nephritis based on comprehensive bioinformatics and machine learning.Front Immunol. 2023 Dec 7;14:1288699. doi: 10.3389/fimmu.2023.1288699. eCollection 2023. Front Immunol. 2023. PMID: 38130724 Free PMC article.
-
Comprehensive analysis of lactate-related gene profiles and immune characteristics in lupus nephritis.Front Immunol. 2024 Feb 22;15:1329009. doi: 10.3389/fimmu.2024.1329009. eCollection 2024. Front Immunol. 2024. PMID: 38455045 Free PMC article.
-
Systematic identification of key extracellular proteins as the potential biomarkers in lupus nephritis.Front Immunol. 2022 Jul 28;13:915784. doi: 10.3389/fimmu.2022.915784. eCollection 2022. Front Immunol. 2022. PMID: 35967373 Free PMC article.
-
Identification and Validation of IFI44 as Key Biomarker in Lupus Nephritis.Front Med (Lausanne). 2021 Oct 25;8:762848. doi: 10.3389/fmed.2021.762848. eCollection 2021. Front Med (Lausanne). 2021. PMID: 34760904 Free PMC article.
-
Machine learning-based identification of novel hub genes associated with oxidative stress in lupus nephritis: implications for diagnosis and therapeutic targets.Lupus Sci Med. 2024 Apr 18;11(1):e001126. doi: 10.1136/lupus-2023-001126. Lupus Sci Med. 2024. PMID: 38637124 Free PMC article.
References
-
- Barrera García A., Gómez-Puerta J. A., Arias L. F., Burbano C., Restrepo M., Vanegas A. L., et al. (2016). Infiltrating CD16(+) are associated with a reduction in peripheral CD14(+)CD16(++) monocytes and severe forms of lupus nephritis. Autoimmune Dis. 2016, 9324315. 10.1155/2016/9324315 - DOI - PMC - PubMed
-
- Breiman L. (2001). Random forests. Mach. Learn. 45, 5–32. 10.1023/A:1010933404324 - DOI
LinkOut - more resources
Full Text Sources
Miscellaneous

