. 2025 Jan 30;7(5):101340.
doi: 10.1016/j.jhepr.2025.101340. eCollection 2025 May.

Metabolomic liquid biopsy dynamics predict early-stage HCC and actionable candidates of human hepatocarcinogenesis

Affiliations

Metabolomic liquid biopsy dynamics predict early-stage HCC and actionable candidates of human hepatocarcinogenesis

Kornelius Schulze et al. JHEP Rep. .

Abstract

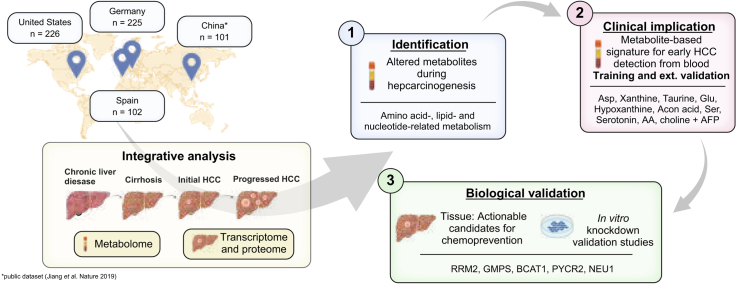
Background & aims: Actionable candidates of hepatocarcinogenesis remain elusive, and tools for early detection are suboptimal. Our aim was to demonstrate that serum metabolome profiles reflect the initiation of hepatocellular carcinoma (HCC) and enable the identification of biomarkers for early HCC detection and actionable candidates for chemoprevention.

Methods: This global cohort study included 654 patients and 801 biospecimens. Following serum metabolome profiling across the spectrum of hepatocarcinogenesis, we conducted a phase II biomarker case-control study for early HCC detection. Findings were independently validated through in silico analysis, mRNA sequencing, and proteome profiling of primary HCC and non-tumoral tissue, and in vitro experiments.

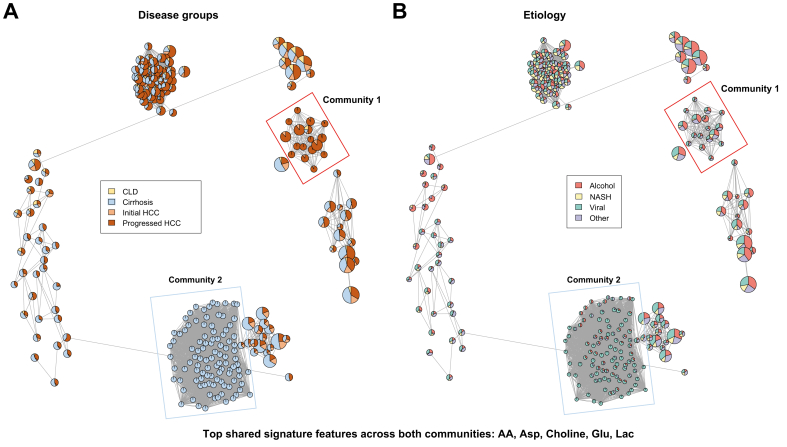
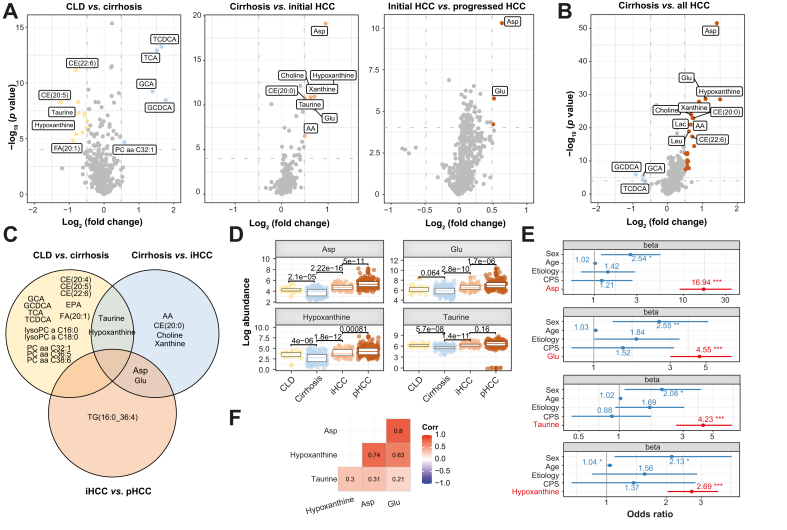
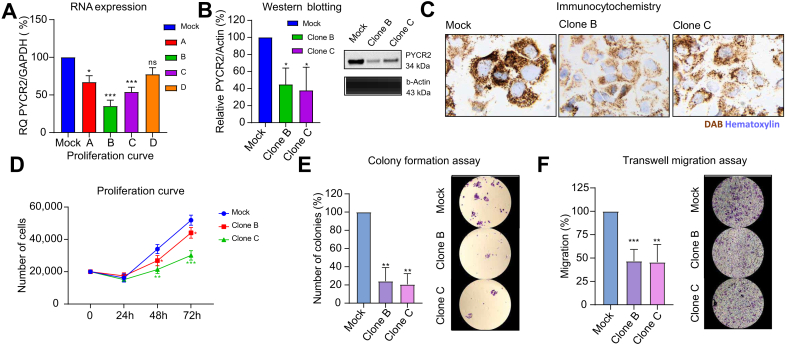
Results: Aspartic acid, glutamic acid, taurine, and hypoxanthine were differentially abundant in the serum across chronic liver disease, cirrhosis, initial HCC, and progressed HCC, independent of sex, age, and etiology. In a phase II biomarker case-control study, a blood-based metabolite signature yielded an AUC of 94% to discriminate between patients with early-stage HCC and controls with cirrhosis, including independent validation. Unsupervised biclustering (MoSBi), lipid network analysis (LINEX2), and pathway enrichment analysis confirmed alterations in amino acid-, lipid-, and nucleotide-related pathways. In tumor tissue, these pathways were significantly deregulated regarding gene and protein expression in two independent datasets, including actionable targets RRM2, GMPS, BCAT1, PYCR2, and NEU1. In vitro knockdown confirmed a functional role in proliferation and migration, as exemplified for PYCR2.

Conclusions: These findings demonstrate that serum metabolome profiling indicates deregulated metabolites and pathways during hepatocarcinogenesis. Our liquid biopsy approach accurately detects early-stage HCC outperforming currently recommended surveillance tools and facilitates identification of actionable candidates for chemoprevention.

Impact and implications: Deregulated cellular metabolism is a hallmark of cancer. In smaller studies, circulating metabolite profiles have been associated with HCC, although mainly in the context of fatty liver disease. Translation strategies for primary prevention or early detection are lacking. In this global study, we present an unsupervised landscape of the altered serum metabolome profile during hepatocarcinogenesis, independent of age, sex, and etiology. We provide a blood-based metabolite signature that accurately identifies early-stage HCC in a phase II biomarker study including independent validation. Further RRM2, GMPS, BCAT1, PYCR2, and NEU1 are identified in tumor tissue as actionable candidates for prevention. Our data provide the rationale for clinical trials testing liquid biopsy metabolome-based signatures for early HCC detection and the development of chemoprevention strategies.

Keywords: Early detection; Liver cancer; Metabolism; Prevention; Surveillance; Tumorigenesis.


Conflict of interest statement

KS has received advisory board fees from Roche, AstraZeneca, and MSD. CZ has received advisory board fees from Roche, MSD, and AstraZeneca. AW has received travel grants, honoraria, and/or advisory board fees from Bayer BMS, Sanofi, Roche, AstraZeneca, MSD, Merck KGaG, and Eisai. SH has received honoraria and/or consulting fees from Janssen Cilag, Ferring, AbbVie, Falk, Galapagos, Lilly, and BMS. BS has received financial support, fees, and/or grants from Astra Zeneca, BMS, Boston Scientific, Eisai, Incyte, MSD, Roche, Sanofi, and Sirtex Medical. JMB has received financial support, fees and/or grants from Albireo, Ipsen, Cymabay, AstraZeneca, Jazz Pharmaceuticals, Servier, Ikan Biotech, OWL Metabolomics, Incyte, Intercept, Advance, and Eisai. JUM has received grants, fees, and/or honoraria from AstraZeneca, MSD, Eisai, Ipsen, BMS, Incyte, and Roche. AV has received consulting fees from FirstWorld, Pioneering Medicine, and Genentech; and advisory board fees from BMS, Roche, Astra Zeneca, Eisai, and NGM Pharmaceuticals. He has stock options from Espervita and Atzeyo. JvF has received honoraria from Roche and AstraZeneca. Please refer to the accompanying ICMJE disclosure forms for further details.

Figures

Image 1
Graphical abstract
Fig. 1
Fig. 1
Study overview. Outline of cohort distribution and experimental workflow. A total of 406 blood specimens from the USA and Germany were combined into the “serum metabolome identification cohort” for the identification of candidates during hepatocarcinogenesis (1) and a subset used for the biomarker analysis for early HCC detection (2). In addition, 102 blood specimens from Spain were used as an “external validation cohort” for the biomarker analysis (2). Biological validation of key metabolic pathways was conducted in 182 patients with 293 available tissue specimens (not all patients had paired tumor and non-tumoral tissue available) from the German (internal cohort) and Chinese cohorts by bulk mRNA-sequencing and proteomics analysis (3), alongside with in vitro studies (4). Some patients from the German cohort were included in both the “serum metabolome identification cohort” and the “biological validation cohort,” according to availability of specimens. BCLC, Barcelona Clinic for Liver Cancer; CLD, chronic liver disease; HCC, hepatocellular carcinoma; iCCA, intrahepatic cholangiocarcinoma; RNAseq, RNA sequencing.
Fig. 2
Fig. 2
Dynamic changes in serum metabolome. Abundance of significantly altered metabolite classes in sera across patients with CLD, cirrhosis, initial HCC, and progressed HCC. Display limited to metabolite classes with at least one significantly different group comparison for CLD vs. cirrhosis, cirrhosis vs. initial HCC, and initial HCC vs. progressed HCC. Student’s t test. CLD, chronic liver disease; HCC, hepatocellular carcinoma.
Fig. 3
Fig. 3
MoSBi analysis. Resulting bicluster network from biclustering analysis on metabolomics data. Biclusters (nodes) are colored by (A) disease group or (B) etiology. Network communities of interest are highlighted. AA, arachidonic acid; CLD, chronic liver disease; HCC, hepatocellular carcinoma; MoSBi, Molecular Signature identification using Biclustering; NASH, non-alcoholic steatohepatitis.
Fig. 4
Fig. 4
Differentially abundant metabolites across spectra of hepatocarcinogenesis. (A) Volcano plots displaying differential abundant metabolites between CLD (yellow) and cirrhosis (blue) (left panel), cirrhosis (blue) and initial HCC (light red) (middle panel), and initial HCC (light red) and progressed HCC (dark red) (right panel). (B) Volcano plot displaying differential abundant metabolites between cirrhosis (blue) and all HCC (dark red). (C) Venn diagram with differentially abundant metabolites by comparison. (D) Box plot for aspartic acid, glutamic acid, hypoxanthine, and taurine. (E) Ordinal logistic regression model, including clinical variables sex, age, etiology, and candidate metabolites. (F) Correlation matrix for top metabolites with Pearson correlation coefficient (all p <0.05). Full annotation for volcano plots is provided in Fig. S6. ∗p <0.05, ∗∗p <0.01, ∗∗∗p <0.001. Student’s t test, Wald test. AA, arachidonic acid; CE, cholesterol esters; CLD, chronic liver disease; CPS, Child-Pugh Score; GCA, glycocholic acid; GCDCA, glycochenodeoxycholic acid; HCC, hepatocellular carcinoma; iCCA, intrahepatic cholangiocarcinoma; PC, phosphatidylcholines; pHCC, progressed HCC; TCA, trichloroacetic acid; TCDCA, taurochenodeoxycholic acid; TG, triacylglycerols.
Fig. 5
Fig. 5
Biomarker analysis. Average area under the ROC curve (AUC, left panel) with indicated AUC, sensitivity, and specificity for a random forest classification model (internal cross-validation with 1,000 iterations) including top 10 metabolites plus AFP with respective candidates based on mean gini ranking (right panel). (A) “Serum metabolome identification cohort”: cirrhosis (n = 149) vs. early-stage HCC (BCLC 0/A, n = 181). (B) Spanish external validation cohort: controls (n = 35) vs. HCC (n = 32). (C) Spanish external validation cohort: HCC (n = 32) vs. iCCA (n = 35). (B and C: signature limited to five of 10 available metabolites in the Spanish dataset plus AFP). AA, arachidonic acid; AFP, alpha fetoprotein; BCLC, Barcelona Clinic for Liver Cancer; HCC, hepatocellular carcinoma; iCCA, intrahepatic cholangiocarcinoma; ROC, receiver operating characteristic.
Fig. 6
Fig. 6
Metabolic pathway analysis. (A) Metabolic pathway analysis for “serum metabolome identification cohort” profiling indicating highly impacted pathways between cirrhosis (n = 149) and HCC (n = 226). (B, C) Differential gene expression analysis between primary HCC tumor and non-tumoral adjacent tissue from the internal (B) and public cohort (C). (D) Protein abundance in HCC tissue of the internal cohort. (E) Differentially abundant proteins in the public cohort. In (B–E), labeled are genes/proteins from mostly altered metabolic pathways identified in previous analysis (red: final candidates with differential gene expression and protein abundance across both cohorts; gray: remaining). Wilcoxon rank-sum test. HCC, hepatocellular carcinoma TCA, tricarboxylic acid.
Fig. 7
Fig. 7
In vitro sh-RNA knockdown experiments targeting PYCR2. (A) RNA expression by RT-qPCR for clone selection. Protein expression of PYCR2 and housekeeper beta-actin by (B) Western blotting and (C) immunocytochemistry. (D) Proliferation curve. (E) Colony formation assay. (F) Transwell migration assay. Data are expressed as mean ± SD of at least three experiments. Representative images acquired at 4 × magnification. ∗p <0.05; ∗∗p <0.01; ∗∗∗p <0.001. Student’s t test. PYCR2, pyrroline-5-carboxylate reductase 2; sh-RNA, short-harpin RNA.
figs1
figs1

References

    1. Rumgay H., Arnold M., Ferlay J., et al. Global burden of primary liver cancer in 2020 and predictions to 2040. J Hepatol. 2022;77:1598–1606. - PMC - PubMed
    1. Villanueva A. Hepatocellular carcinoma. N Engl J Med. 2019;380:1450–1462. - PubMed
    1. Llovet J.M., Kelley R.K., Villanueva A., et al. Hepatocellular carcinoma. Nat Rev Dis Primers. 2021;7:6. - PubMed
    1. Craig A.J., von Felden J., Garcia-Lezana T., et al. Tumour evolution in hepatocellular carcinoma. Nat Rev Gastroenterol Hepatol. 2020;17:139–152. - PubMed
    1. Tzartzeva K., Obi J., Rich N.E., et al. Surveillance imaging and alpha fetoprotein for early detection of hepatocellular carcinoma in patients with cirrhosis: a meta-analysis. Gastroenterology. 2018;154:1706–17018. e1. - PMC - PubMed

LinkOut - more resources