

Integrated transcriptomics of multiple sclerosis peripheral blood mononuclear cells explored potential biomarkers for the disease
- PMID: 40290807
- PMCID: PMC12033924
- DOI: 10.1016/j.bbrep.2025.102022
Integrated transcriptomics of multiple sclerosis peripheral blood mononuclear cells explored potential biomarkers for the disease
Abstract
Background: Despite their importance, blood RNAs have not been comprehensively studied as potential diagnostic markers for multiple sclerosis (MS). Herein, by the integration of GSE21942 and GSE203241 microarray profiles of peripheral blood mononuclear cells, this study explored potential biomarkers for the disease.
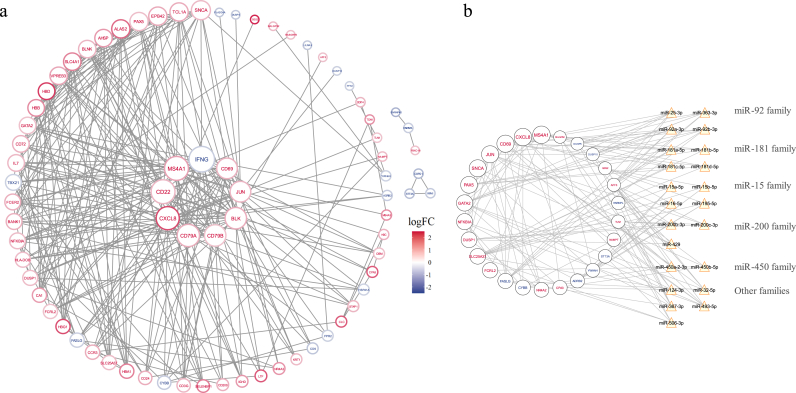
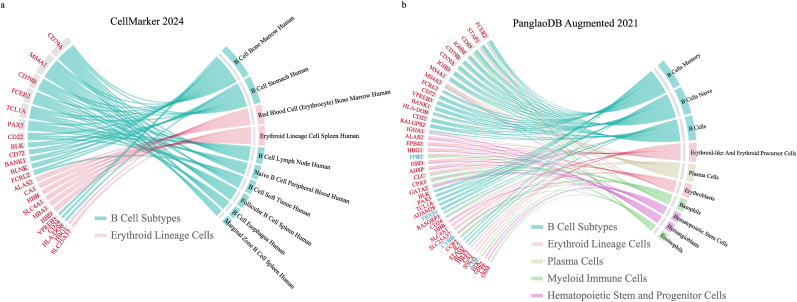
Methods: After identification of differentially expressed genes (DEGs), functional enrichment analyses were performed, and PPI and miRNA-mRNA regulatory networks were constructed. After implementing weighted gene co-expression network analysis (WGCNA) and discovering MS-specific modules, the converging results of differential expression analysis and WGCNA were subjected to machine learning methods. Lastly, the diagnostic performance of the prominent genes was evaluated by receiver operating characteristic (ROC) analysis.
Results: COPG1, RPN1, and KDM3B were initially highlighted as potential biomarkers based on their acceptable diagnostic efficacy in the integrated data, as well as in both GSE141804 and GSE146383 datasets as external validation sets. However, given that they were downregulated in the integrated data while they were upregulated in the validation sets, they could not be considered as potential biomarkers for the disease. In addition to this inconsistency, evaluating their diagnostic performance in other external datasets (GSE247181, GSE59085, and GSE17393) did not reveal their diagnostic efficacy.
Conclusions: This study could not unveil promising blood biomarkers for MS, possibly due to a small sample size and unaccounted confounding factors. Considering PBMCs and blood specimens as valuable sources for the identification of biomarkers, further transcriptomic analyses are needed to discover potential biomarkers for the disease.
Keywords: Biomarkers; Multiple sclerosis; PBMCs.
© 2025 The Author.
Conflict of interest statement
The authors declare that they have no known competing financial interests or personal relationships that could have appeared to influence the work reported in this paper.
Figures


Similar articles
-
Blood transcriptomics identifies FEZ1 as a potential biomarker for inflammatory bowel disease.Comput Biol Med. 2025 Mar;187:109742. doi: 10.1016/j.compbiomed.2025.109742. Epub 2025 Feb 1. Comput Biol Med. 2025. PMID: 39894009
-
Identification and Verification of Five Potential Biomarkers Related to Skin and Thermal Injury Using Weighted Gene Co-Expression Network Analysis.Front Genet. 2022 Jan 3;12:781589. doi: 10.3389/fgene.2021.781589. eCollection 2021. Front Genet. 2022. PMID: 35047008 Free PMC article.
-
Six potential biomarkers in septic shock: a deep bioinformatics and prospective observational study.Front Immunol. 2023 Jun 8;14:1184700. doi: 10.3389/fimmu.2023.1184700. eCollection 2023. Front Immunol. 2023. PMID: 37359526 Free PMC article.
-
HEMGN and SLC2A1 might be potential diagnostic biomarkers of steroid-induced osteonecrosis of femoral head: study based on WGCNA and DEGs screening.BMC Musculoskelet Disord. 2021 Jan 15;22(1):85. doi: 10.1186/s12891-021-03958-7. BMC Musculoskelet Disord. 2021. PMID: 33451334 Free PMC article.
-
Identification of important modules and biomarkers in tuberculosis based on WGCNA.Front Microbiol. 2024 Feb 8;15:1354190. doi: 10.3389/fmicb.2024.1354190. eCollection 2024. Front Microbiol. 2024. PMID: 38389525 Free PMC article.
References
-
- Bando Y. Mechanism of demyelination and remyelination in multiple sclerosis. Clinical and Experimental Neuroimmunology. 2020;11:14–21.
LinkOut - more resources
Full Text Sources
Miscellaneous
