. 2025 Apr 15:45:100991.
doi: 10.1016/j.bbih.2025.100991. eCollection 2025 May.

Obesity accelerates age-related memory deficits and alters white matter tract integrity in Ldlr-/-.Leiden mice

Affiliations

Obesity accelerates age-related memory deficits and alters white matter tract integrity in Ldlr-/-.Leiden mice

Florine Seidel et al. Brain Behav Immun Health. .

Abstract

Background: Obesity in mid-adulthood has been suggested to promote brain aging and is associated with progressive cognitive impairment later in life. However, the structural and functional alterations that underlie obesity-related cognitive dysfunction are still poorly understood, partly owing to the lack of translational models replicating age- and obesity-related brain pathology.

Methods: The effect of age and high-fat diet (HFD)-induced obesity was investigated in adult Ldlr-/-.Leiden mice, an established translational model for obesity and its comorbidities. During mid-adulthood, from three to eight months of age, brain structure and function (hippocampal volume, cortical thickness, white matter integrity, cerebral blood flow (CBF), resting-state functional connectivity) were monitored with brain magnetic resonance imaging, and cognitive function was evaluated using cognitive tests. Brain pathology was further examined with histopathological and gene expression analyses.

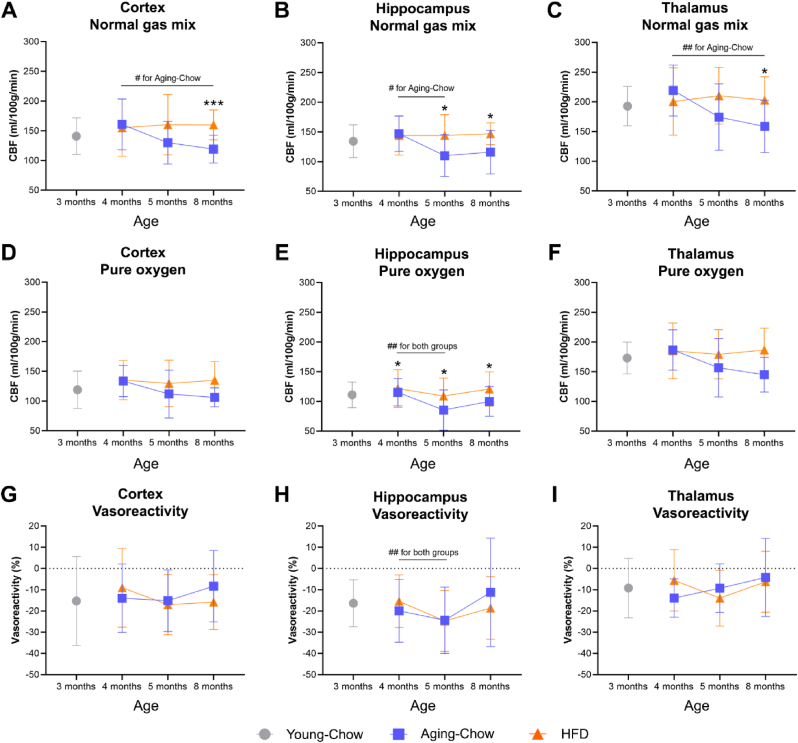
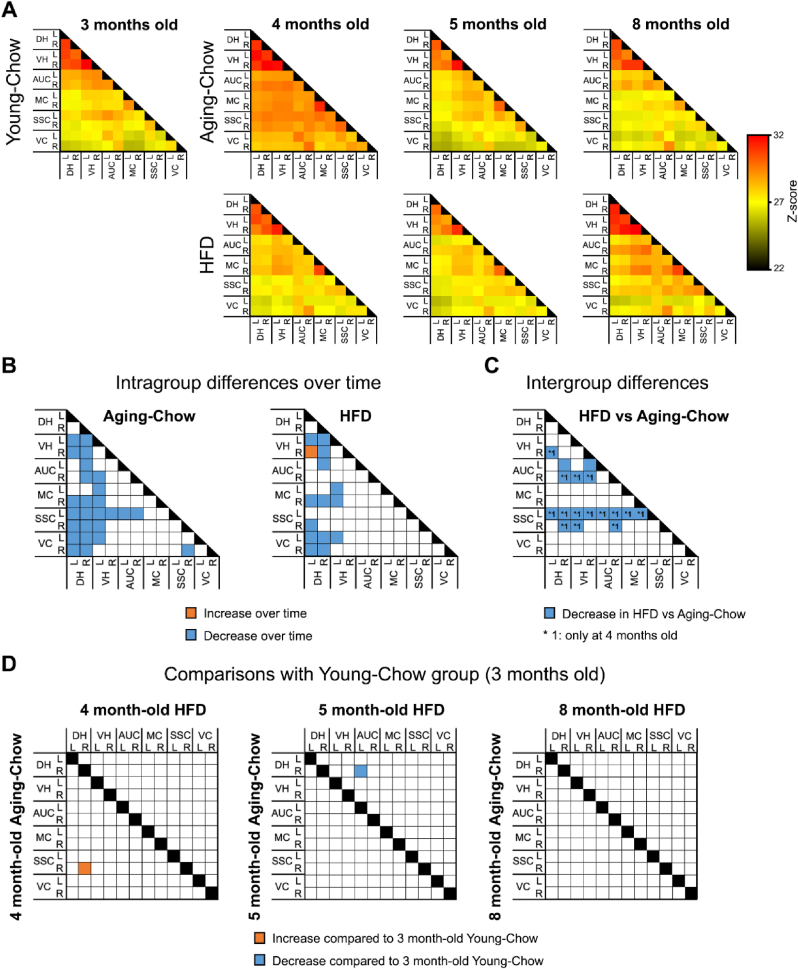
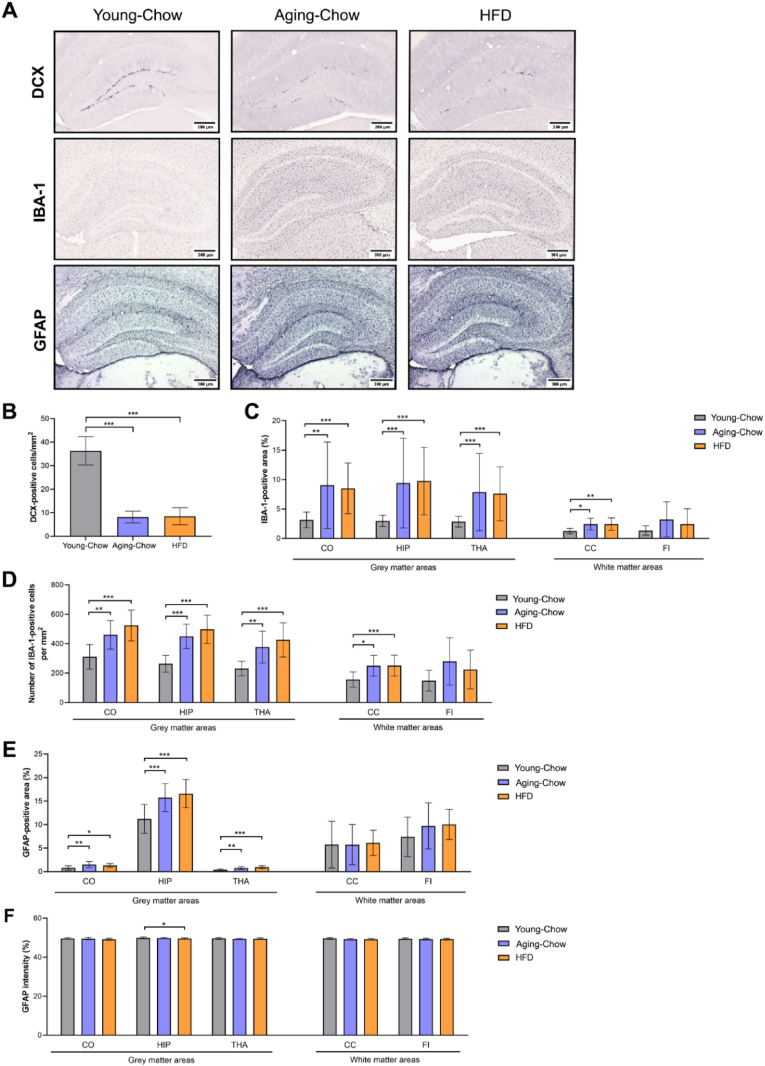
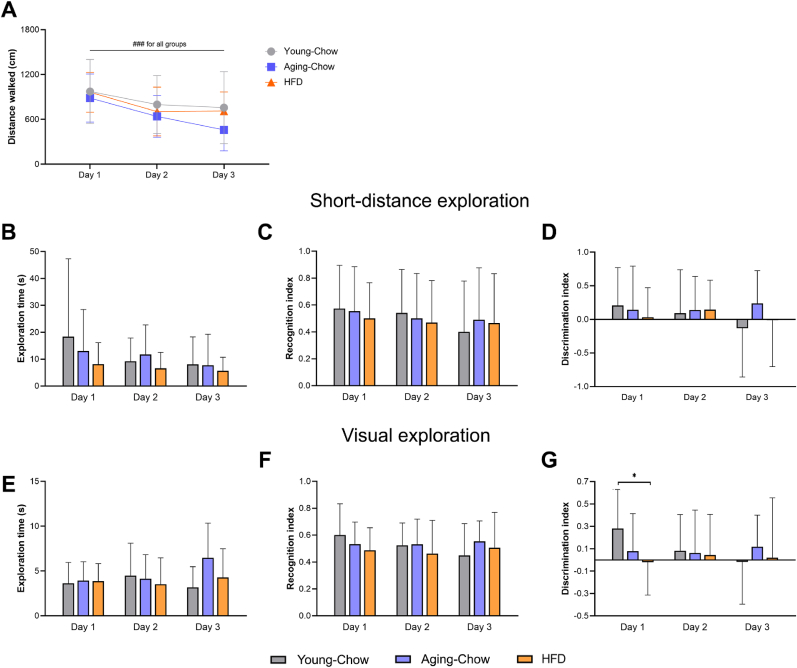
Results: Ldlr-/-.Leiden mice showed age-related decreases in cortical thickness, CBF, brain connectivity, and neurogenesis along with the development of neuroinflammation and (short-term) memory impairments. On HFD feeding, Ldlr-/-.Leiden mice exhibited similar features, but memory deficits started at a younger age than in chow-fed mice. HFD-fed mice additionally showed a rise in CBF with concomitant decline in fractional anisotropy in white matter tracts. Analyses of hippocampal gene expression further revealed an age-related suppression of processes related to metabolic and neuronal function while HFD feeding strongly activated neuroinflammatory pathways.

Conclusions: Ldlr-/-.Leiden mice show similar critical age-related changes in brain structure and function as observed in humans. In this mouse model, HFD feeding particularly trigger disturbances in brain blood perfusion and white matter tract integrity, which may underlie an accelerated cognitive decline in obesity.

Keywords: Aging; Cognitive impairment; Neurodegeneration; Neuroimaging; Obesity.


Conflict of interest statement

The authors declare that they have no known competing financial interests or personal relationships that could have appeared to influence the work reported in this paper.

Figures

Fig. 1
Fig. 1
Experimental design. At the start of the study the animals were 10–12 weeks old (∼2.5 months of age corresponding to young adults). One group of chow-fed mice (Young-Chow, n = 15) was euthanized at 3 months of age as a young lean (healthy) reference. From 2.5 to 8 months of age, one aging group (Aging-Chow, n = 15) remained on a standardized chow diet and another aging group (HFD, n = 17) was fed an obesity-inducing energy-dense high-fat diet (HFD). At 3 months of age for the Young-Chow group (dotted lines) and at 4, 5 and 8 months of age for the Aging-Chow and HFD groups (solid lines), brain MRI was performed to assess brain structure (cortical thickness, hippocampus size, white matter integrity) and brain function (CBF and vasoreactivity, rs-FC) and behavioral tests ((reverse)Morris Water Maze (MWM) and Object Recognition Test (ORT)) were conducted to assess short-term memory and spatial learning. At sacrifice, the brains were collected for histopathological analyses and hippocampal RNA sequencing (RNAseq).
Fig. 2
Fig. 2
Body weight and metabolic health. (A) body weight, (B) blood glucose, (C) plasma cholesterol and (D) plasma triglyceride contents in Young-Chow (3 months old) and over aging in Aging-Chow and HFD groups. Data are shown as mean ± SD. #p < 0.05, ###p < 0.001 for intragroup effects over time; ∗p < 0.05, ∗∗p < 0.01, ∗∗∗p < 0.001 for intergroup effects.
Fig. 3
Fig. 3
Cortical thickness and hippocampal volume. (A) Average cortical thickness and hippocampal volume were measured on T2-weighted anatomical images. Data are shown as mean ± SD. ∗p < 0.05, ∗∗p < 0.00.01 for intergroup effects.
Fig. 4
Fig. 4
Fractional anisotropy in white matter and grey matter. Using DTI, fractional anisotropy (FA) was measured in (A) white matter including (B) the optic tract, (C) the corpus callosum and (D) the fornix, and in (E) grey matter including (F) hippocampus, (G) basal ganglia (caudate nucleus, putamen and globus pallidus), (H) auditory cortex, (I) motor cortex, (J) somatosensory cortex and (K) visual cortex. Data are shown as mean ± SD. #p < 0.05, ###p < 0.001 for intragroup effects over time; ∗p < 0.05, ∗∗p < 0.01, ∗∗∗p < 0.001 for intergroup effects.
Fig. 5
Fig. 5
Cerebral perfusion based on arterial spin labeling. (A–C) Cerebral blood flow (CBF) under normal gas mix (1:2 oxygen-air) and (D–F) CBF under pure oxygen (vasoconstrictive conditions) were measured in the cortex, hippocampus and thalamus using an arterial spin labeling. (G–I) Vasoreactivity was measured as the difference between CBF under pure oxygen and CBF under normal gas mix and normalized by CBF under normal gas mix. For vasoreactivity, a lower negative value indicates higher vasoreactivity (i.e. a greater ability to constrict/dilate the vessels). Data are shown as mean ± SD. #p < 0.05, ##p < 0.01 for intragroup effects over time; ∗p < 0.05, ∗∗∗p < 0.001 for intergroup effects.
Fig. 6
Fig. 6
Rs-FC based on total correlations in resting-state functional MRI. (A) Heatmaps showing total correlations between brain regions in Young-Chow (3 months old), Aging-Chow and HFD groups. A higher z-score indicates stronger functional connectivity. (B) Overall intragroup changes in rs-FC between 4 and 8 months of age in Aging-Chow and HFD groups. (C) Group differences in rs-FC between HFD and Aging-Chow groups. (D) Comparison of rs-FC of 4 month-old, 5 month-old and 8-month old Aging-Chow and HFD groups with rs-FC of Young-Chow group (3 months old). Abbreviations: (DH) dorsal hippocampus; (VH) ventral hippocampus; (AUC) auditory cortex; (MC) motor cortex; (SSC) somatosensory cortex; (VC) visual cortex in left (L) and right (R) hemispheres.
Fig. 7
Fig. 7
Neurogenesis and neuroinflammation. (A) Representative pictures of coronal brain cross-sections stained for DCX as a marker for neurogenesis, IBA-1 as a marker for microglia activation and GFAP as a marker for astrogliosis, for the Young-Chow (3 months of age), Aging-Chow (8 months of age) and HFD (8 months of age) groups. (B) Quantification of DCX-positive neurons (newly-generated neurons) in the dentate gyrus of the hippocampus. Quantification of (C) IBA-1-positive area and (D) number of IBA-1-positive cells in grey matter areas (i.e. cortex (CO), hippocampus (HIP), thalamus (THA)) and white matter areas (i.e. corpus callosum (CC), fimbria (FI)). Quantification of (E) GFAP-positive area and (F) GFAP staining intensity in grey matter areas including CO, HIP and THA.∗p < 0.05, ∗∗p < 0.01, ∗∗∗p < 0.001 for intergroup effects.
Fig. 8
Fig. 8
Cerebrovascular integrity. (A) Representative pictures of coronal brain cross-sections stained for GLUT-1 as a marker for capillaries or stained with Masson's trichrome to detect atherosclerosis and endothelial dysfunction for Young-Chow (3 months of age), Aging-Chow (8 months of age) and HFD (8 months of age) groups. Quantification of (B) GLUT-1-positive area and (C) capillary density in grey matter areas (i.e. cortex (CO), hippocampus (HIP), thalamus (THA)) and white matter areas (i.e. corpus callosum (CC), fimbria (FI)). ∗p < 0.05, for intergroup effects.
Fig. 9
Fig. 9
Object Recognition test (ORT). An ORT was performed over 3 days in the Young-Chow group (3 months of age), Aging-Chow group (5 months of age) and HFD group (5 months of age) to assess short-term memory and general behavior. (A) The total distance walked was measured over the three ORT days. The (B) total exploration time, (C) recognition index and (D) discrimination index were first determined based on short-distance exploration (nose-point located within 2-cm diameter around the object). In parallel, the (E) total exploration time, (F) recognition index and (G) discrimination index were also determined based on visual exploration (head directed towards the object). Data are shown as mean ± SD. ###p < 0.001 for intragroup effects over time; ∗p < 0.05 for intergroup effects.
Fig. 10
Fig. 10
Reverse Morris Water Maze (rMWM) test. A rMWM test was performed in the Young-Chow group (3 months of age), Aging-Chow group (8 months of age) and HFD group (8 months of age) to assess short-term memory and spatial learning. (A) Average velocity, (B) escape latency and (C) total distance moved were determined during the two-day acquisition phase for a new platform location (learning phase). (D) Average cognitive score per day (0: thigmotaxis, 1: random search, 2: scanning, 3: chaining, 4: indirect search or semi-focal search or focal search, 5: directed search, 6: direct path). (E) Percentage of hippocampal-search strategies used during the four days of the acquisition phase (scores 4–6 were considered hippocampus-dependent search strategies). During the probe phase, (F) the velocity, (G) the time spent in the South-West (SW) quadrant and (H) the time spent in the platform zone were determined. Data are shown as mean ± SD. ##p < 0.01 for intragroup effects over time; ∗p < 0.05, ∗∗p < 0.01, ∗∗∗p < 0.001 for intergroup effects.

References

    1. Amen D.G., Wu J., George N., Newberg A. Patterns of regional cerebral blood flow as a function of obesity in adults. J. Alzheim. Dis. 2020;77:1331–1337. doi: 10.3233/JAD-200655. - DOI - PMC - PubMed
    1. Arnoldussen I.A.C., Wiesmann M., Pelgrim C.E., Wielemaker E.M., Van Duyvenvoorde W., Amaral-Santos P.L., Verschuren L., Keijser B.J.F., Heerschap A., Kleemann R., Wielinga P.Y., Kiliaan A.J. Butyrate restores HFD-induced adaptations in brain function and metabolism in mid-adult obese mice. Int. J. Obes. 2017;41:935–944. doi: 10.1038/ijo.2017.52. - DOI - PubMed
    1. Arnoldussen I.A.C., Morrison M.C., Wiesmann M., van Diepen J.A., Worms N., Voskuilen M., Verweij V., Geenen B., Gualdo N.P., van der Logt L., Gross G., Kleemann R., Kiliaan A.J. Milk fat globule membrane attenuates high fat diet-induced neuropathological changes in obese Ldlr−/−.Leiden mice. Int. J. Obes. 2022;46:342–349. doi: 10.1038/s41366-021-00998-w. - DOI - PubMed
    1. Bartsch T., Wulff P. The hippocampus in aging and disease: from plasticity to vulnerability. Neuroscience. 2015;309:1–16. doi: 10.1016/j.neuroscience.2015.07.084. - DOI - PubMed
    1. Behler A., Kassubek J., Müller H.P. Age-related alterations in DTI metrics in the human brain—consequences for age correction. Front. Aging Neurosci. 2021;13:1–15. doi: 10.3389/fnagi.2021.682109. - DOI - PMC - PubMed

LinkOut - more resources