. 2025 Apr 23:18:585-601.
doi: 10.2147/OTT.S491130. eCollection 2025.

A Pyroptosis-Related LncRNA Signature for Predicting Prognosis, Immune Features and Drug Sensitivity in Ovarian Cancer

Affiliations

A Pyroptosis-Related LncRNA Signature for Predicting Prognosis, Immune Features and Drug Sensitivity in Ovarian Cancer

Po-Wu Liu et al. Onco Targets Ther. .

Abstract

Background: Multiple studies have suggested that lncRNAs and pyroptosis play important roles in ovarian cancer (OC). However, the function of pyroptosis-related lncRNAs (PRLs) in OC is not fully understood.

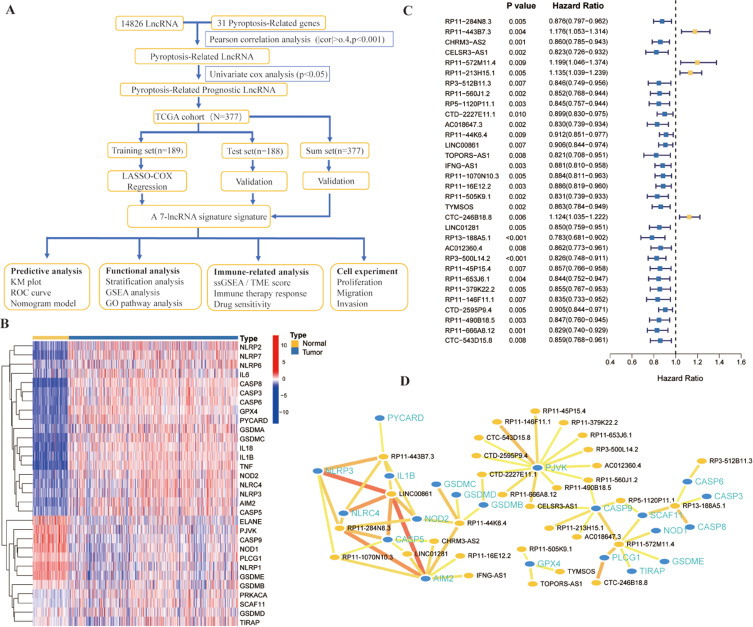
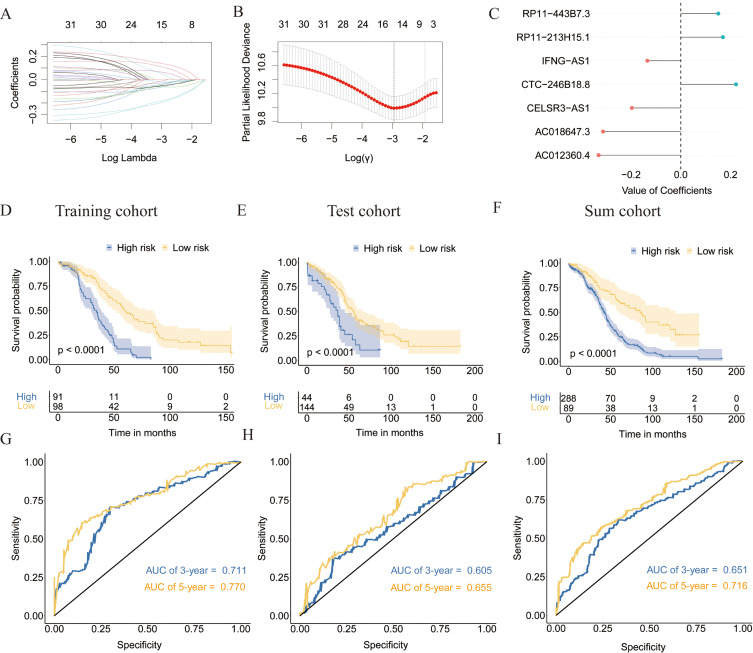
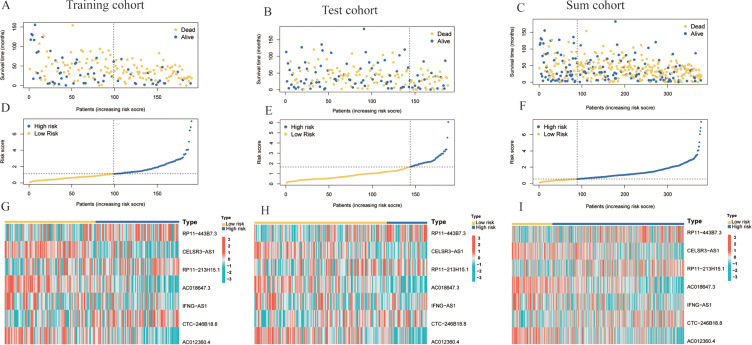
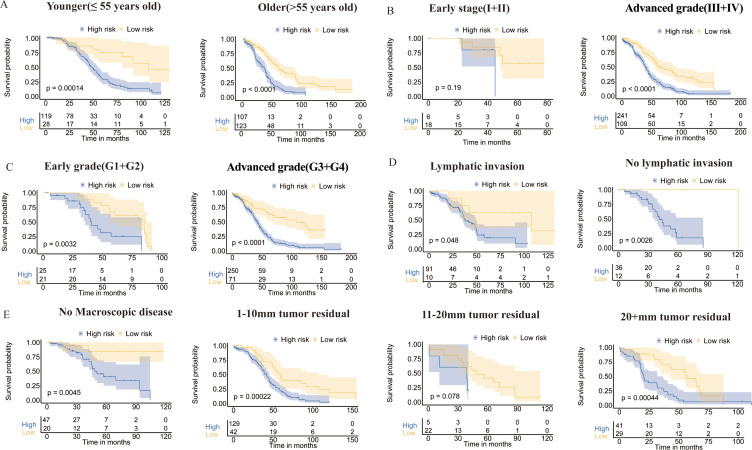
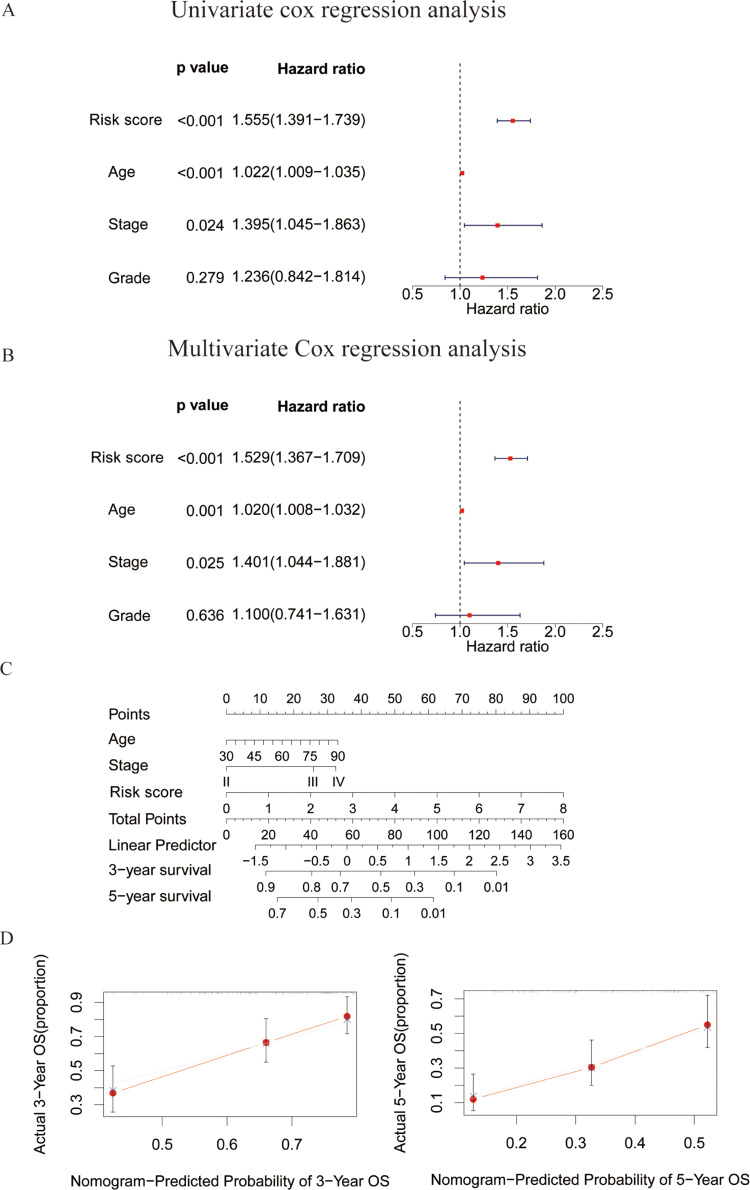
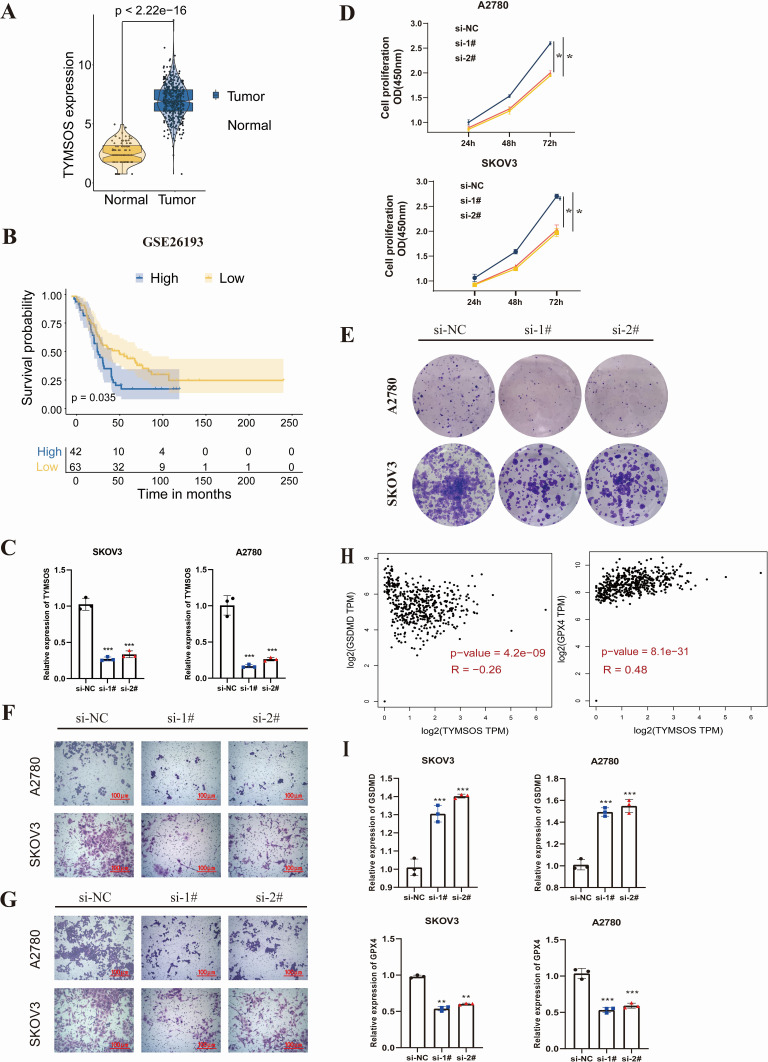
Methods: Clinical information and RNA-seq data of OC patients (n = 379) were collected from TCGA database. Pearson correlation analysis and univariate Cox analysis were performed to identify prognostic PRLs, respectively. LASSO-COX regression was utilized to construct a prognostic PRLs signature. Kaplan-Meier (K-M) curve analyses and receiver operating characteristics (ROC) were used to evaluate the prognostic prediction of the signature. The association between risk score and tumor microenvironment infiltration, immunotherapy response and chemotherapy sensitivity were also analyzed. In addition, the function of TYMSOS on OC and pyroptosis was experimentally confirmed in cell lines.

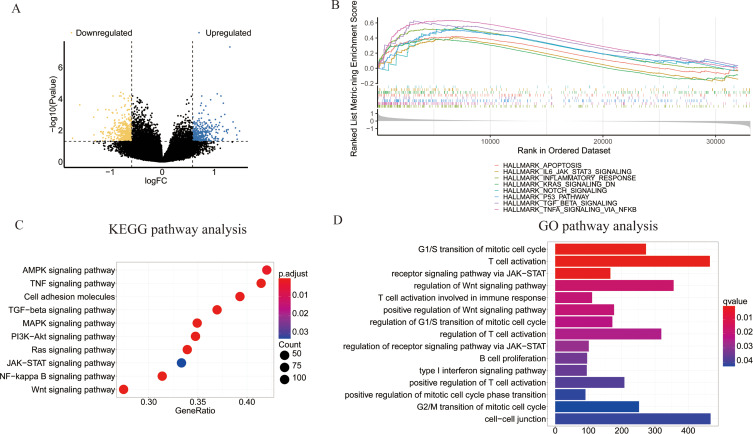
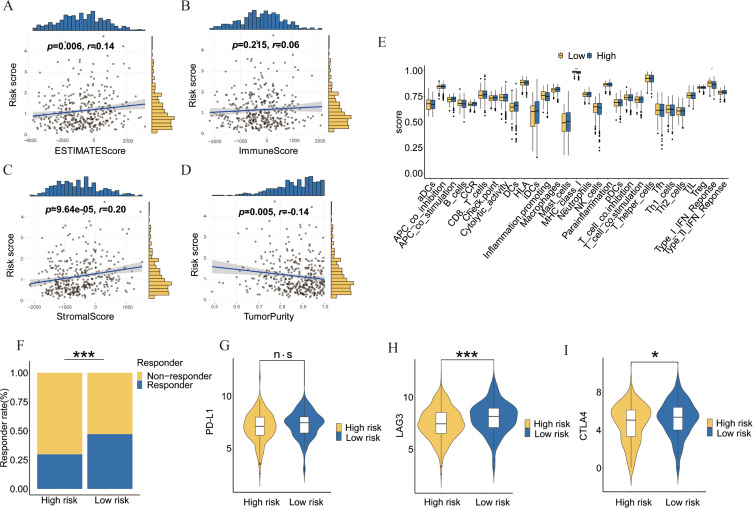
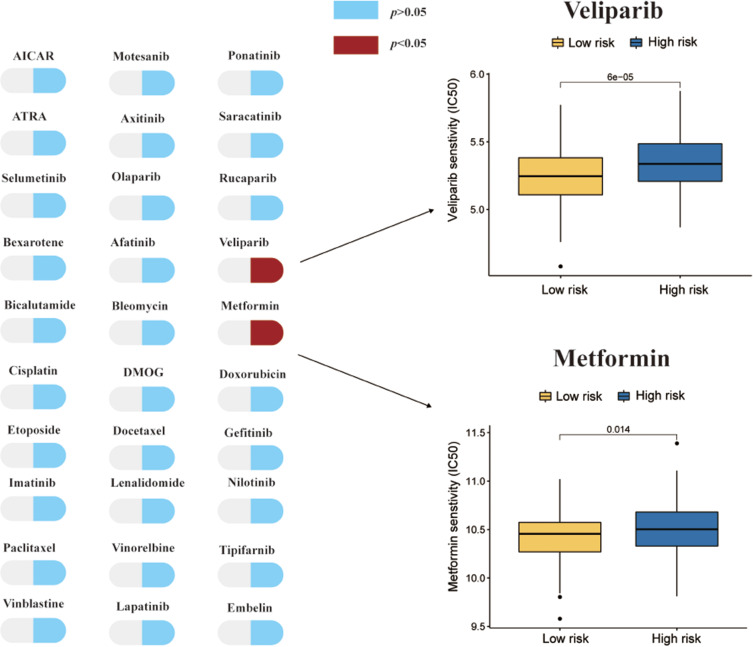
Results: Firstly, 32 prognostic PRLs were identified, and a novel prognostic PRLs signature was constructed and validated. Surprisingly, the prognostic PRLs signature could solidly predict the clinical outcome of patients with OC and patients with high-risk score shown a short overall survival. GSEA results suggested that the RPLs were mainly enriched in the inflammatory response pathway, p53 pathway, TGF-β signaling and TNFα signaling. Besides, our results demonstrated that the risk score was significantly associated with patients with immune infiltration, immunotherapy response and the sensitivity of veliparib and metformin. Furthermore, the oncogene effect of TYMSOS on OC by inhibiting pyroptosis was verified by experiments.

Conclusion: This study found that the prognostic PRLs signature may serve as an efficient biomarker in predicting the prognosis, tumor microenvironment infiltration, and sensitivity of chemotherapeutic agents. TYMSOS is a potential biomarker in OC, and it might promote tumor progression by inhibiting pyroptosis.

Keywords: immune microenvironment; ovarian cancer; prognosis; pyroptosis; signature.


Conflict of interest statement

The authors declare that there are no conflicts of interest.

Figures

Figure 1
Figure 1
Identification of pyroptosis-related genes (PRGs) and pyroptosis-related lncRNAs (RPLs); (A) The flowchart of the whole process of data analysis; (B) A Heatmap of the PRGs between the normal ovary and tumor tissues (blue: low expression level; red: high expression level; Normal: brilliant blue; Tumor, yellow); (C) A forest plot of the prognostic ability of the PRLs; (D) The interaction network of the prognostic-PRLs and the PRGs (blue: PRGs; Orange: prognostic-PRLs).
Figure 2
Figure 2
The construction and validation of a 7-PRLs prognostic signature. (A) LASSO regression of the prognostic PRLs; (B) 10 times cross-validation for tuning the parameter selection in the LASSO regression; (C) The coefficients of the signature; (DF) Kaplan–Meier curves for the OS of patients in the training cohort (D) and the test cohort (E) and the sum cohort (F); (GI) The time-dependent ROC curves to assess the prognostic capabilities of the risk score in the training cohort (G) and the test cohort (H) and the sum cohort (I).
Figure 3
Figure 3
The association between risk score and survival status and seven PRLs expression; (AC) The distributions of survival status of OC patients in the training cohort and the test cohort and the sum cohort; (DF) The risk score calculated in the training cohort and the test cohort and the sum cohort; (GI) The Heatmap showed the expression profiles of seven PRLs between the high- and low-risk subgroups.
Figure 4
Figure 4
Stratification analysis to assess the prognostic value of risk score in subgroups divided based on age (A), FIGO stage (B), grade (C), lymphatic invasion (D) and tumor residual size (E).
Figure 5
Figure 5
Construction of nomogram based on clinical features and risk score. (A and B) The forest plot represents the univariate and multivariate Cox analyses to select the independent prognostic predictors; (C) Establishment of a nomogram based on risk score, age, and stage to predict 3-, 5-year OS in the TCGA cohort; (D) Calibration plots of the nomogram to predict OS at 3-, 5-year.
Figure 6
Figure 6
Functional analysis based on the DEGs between the high- and low-risk subgroups. (A) The volcano plot showed the different expression genes between high- and low-risk subgroups; (B) Gene set enrichment analysis to screen DEGs; (C) The bubble plot displayed the analysis of KEGG pathway enrichment; (D) The bar plot revealed the analysis of GO pathway enrichment.
Figure 7
Figure 7
Association between the prognostic PRLs signature and tumor microenvironment infiltration and immunotherapy response. (AD) Correlation between risk score and ESTIMATEScore, ImmuneScore, StromalScore and TumorPurity; (E) The differences of immune cells calculated by the ssGSEA analysis in high- and low-risk subgroups; (F) The different proportion of patients between high- and low-risk subgroups to immunotherapy; (GI) The different expression of immune checkpoints including PD-L1, CTLA4 and LAG3 in high- and low-risk subgroups. *P < 0.05, ***P < 0.001, ****P < 0.0001; n.s indicates non-significant.
Figure 8
Figure 8
Estimated drug sensitivity in patients with high- and low-risk subgroups.
Figure 9
Figure 9
Inhibition of lncRNA TYMSOS reduced cell proliferation, invasion and migration. (A) TYMSOS was significantly upregulated in ovarian cancer tissues; (B) The KM plot showed that the high expression of TYMSOS had a remarkably worse prognosis in GSE26193 cohorts; (C) The expression of TYMSOS was significantly inhibited after treating with siRNA for 48h. (D and E) the inhibition of TYMSOS significantly reduced the proliferation of A2780 and SKOV3 cells; (F and G) Inhibition of TYMSOS led to remarkable decrease in migratory capacity and invasion ability of A2780 and SKOV3 cells; (H) TYMSOS was negatively correlated with GSDMD and positively correlated with GPX4 in the TCGA and GTEx combined dataset; (I) Inhibition of TYMSOS expression increased the mRNA expression of GSDMD and decreased the mRNA expression of GPX4 in A780 and SKOV3 cell lines. *P < 0.05, **P < 0.01, ***P < 0.001.

Similar articles

References

    1. Menon U, Karpinskyj C, Gentry-Maharaj A. Ovarian cancer prevention and screening. Obstet Gynecol. 2018;131(5):909–927. doi:10.1097/AOG.0000000000002580 - DOI - PubMed
    1. Siegel RL, Giaquinto AN, Jemal A. Cancer statistics, 2024 [published correction appears in CA Cancer J Clin. 2024 Mar-Apr;74(2):203]. CA Cancer J Clin. 2024;74(1):12–49. doi:10.3322/caac.21820 - DOI - PubMed
    1. Kuroki L, Guntupalli SR. Treatment of epithelial ovarian cancer. BMJ. 2020;371:m3773. doi:10.1136/bmj.m3773 - DOI - PubMed
    1. Holmes D. The problem with platinum. Nature. 2015;527(7579):S218–S219. doi:10.1038/527S218a - DOI - PubMed
    1. Koren E, Fuchs Y. Modes of regulated cell death in cancer. Cancer Discov. 2021;11(2):245–265. doi:10.1158/2159-8290.CD-20-0789 - DOI - PubMed

LinkOut - more resources