[Preprint]. 2025 Apr 8:2025.04.08.647881.
doi: 10.1101/2025.04.08.647881.

Identification of a stress-sensitive endogenous opioid-containing neuronal population in the paranigral ventral tegmental area

Affiliations

Identification of a stress-sensitive endogenous opioid-containing neuronal population in the paranigral ventral tegmental area

Carrie Stine et al. bioRxiv. .

Abstract

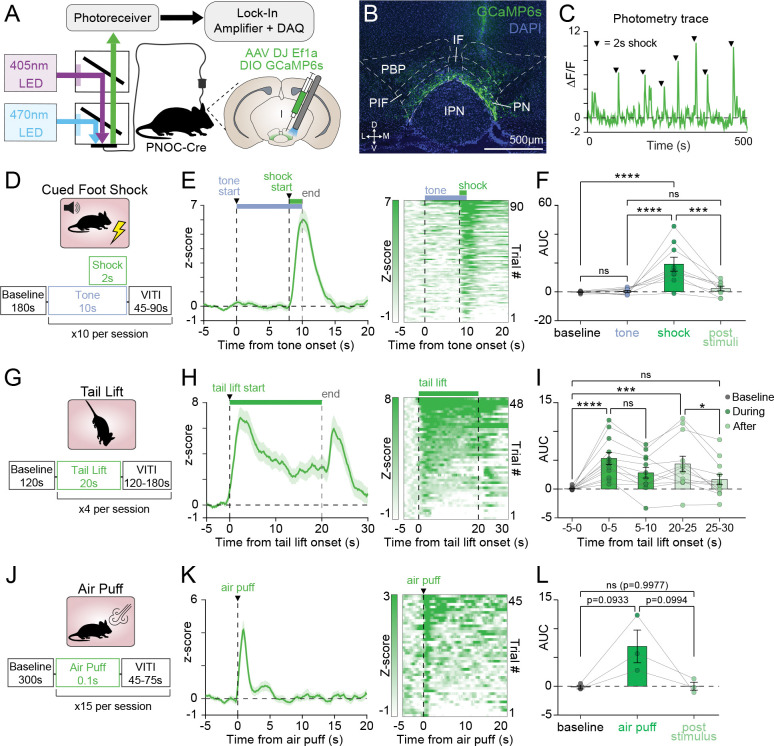
Nociceptin/orphanin FQ (N/OFQ), an endogenous opioid neuropeptide, and its G-protein coupled receptor NOPR have been implicated in motivation, feeding behaviors, and aversion. Stress-induced dysfunction in these states is central to the development of numerous psychiatric disorders, and the N/OFQ-NOPR system's role in reward- and stress-related responses has driven broad interest in NOPR as a therapeutic target for anxiety and depression. However, the impact of stress on N/OFQ signaling in the context of its influence on discrete midbrain reward circuitry remains unknown. To this end, we focused on a possible candidate population of N/OFQ neurons in the paranigral ventral tegmental area (pnVTAPNOC) that have been shown to act locally on NOPR-containing VTA dopamine neurons to suppress motivation. Here we report and characterize pnVTAPNOC sensitivity to stress exposure and identify a functional excitatory and inhibitory afferent input to this subpopulation from the lateral hypothalamus (LH). Our results indicate that pnVTAPNOC neurons become recruited during exposure to a range of acute stressor types, whereas the GABAergic input from the LH to this population is suppressed by predator odor stress, providing a mechanism for disinhibition of these neurons. These findings suggest that this N/OFQ population in the pnVTA could act as a critical bridge between stress and motivation through interactions with upstream hypothalamic circuitry.

Keywords: nociceptin; orphanin F/Q; stress.


Conflict of interest statement

COMPETING INTERESTS The authors declare no competing interests.

Figures

FIGURE 1
FIGURE 1. pnVTAPNOC neurons are activated during exposure to acute stressors.
A Fiber photometry schematic and cartoon of DIO-GCaMP6s (GCaMP6s) viral injection and fiber implant in the pnVTA of PNOC-Cre mice. B Representative coronal image showing DAPI (blue) and GCaMP6s (green) expression in pnVTA. C Representative trace of GCaMP6s F/F fluorescence throughout a cued foot shock session. Black arrows are aligned with foot shock onset. D Trial structure for a cued foot shock session (10s tone co-terminating with 2s 0.5 mA shock). E Left: Averaged trace of pnVTAPNOC GCaMP6s activity during epoch surrounding tone-cued foot shock, aligned to tone onset. Right: Heat map of GCaMP6s fluorescence during same epoch, each row correspond to a trial in the averaged trace (left). (N = 9 mice). F Area under the curve (AUC) for averaged traces from E, calculated over 8-second intervals surrounding cued-foot shock events. GCaMP6s signal increases in response to shock but not tone (1-way ANOVA with Tukey’s multiple comparisons test, ****p < 0.0001, ***p < 0.001, N = 9 mice). G–I Same as D–F but for pnVTAPNOC GCaMP6s activity during 20s tail lift. Activity averaged in 5-second intervals surrounding each tail lift shows increases first during tail lift and again when animal is lowered to the ground (1-way ANOVA with Tukey’s multiple comparisons test, ****p < 0.0001, ***p < 0.001, *p < 0.05, N = 12 mice). J–L Same as D–F but for pnVTAPNOC GCaMP6s activity during acute air puff (0.1s, 20 PSI). Activity averaged in 5-second intervals surrounding each air puff (1-way ANOVA with Tukey’s multiple comparisons test, N = 3 mice). All data represented as mean ± SEM.
FIGURE 2
FIGURE 2. Anxiogenic exploratory behaviors drive pnVTAPNOC activity.
A Cartoon of DIO-GCaMP6s (GCaMP6s) injection and fiber implant into pnVTA of PNOC-Cre mice. GCaMP6s activity was recorded during open field test (OFT) and elevated zero maze (EZM). B Left: Averaged traces of pnVTAPNOC GCaMP6s activity during high-anxiety epochs of the OFT, aligned to entries into the center zone of the open field arena. Right: Area under the curve (AUC) for averaged traces (left) calculated over 5-second intervals surrounding center zone entry. GCaMP6s activity increases during and immediately after center entry (1-way ANOVA with Tukey’s multiple comparisons test, ****p < 0.0001, **p < 0.01, N = 16 mice). C Same as B but for pnVTAPNOC GCaMP6s activity during high-anxiety epochs of the EZM, aligned to entries into either open arm of the maze (1-way ANOVA with Tukey’s multiple comparisons test, **p < 0.01, *p < 0.05, N = 16 mice). D Heat map from a representative animal showing proportion of time spent in each area of the open field arena. Heat map shows more time spent around the edge than in the center. E Same as D but showing proportion of time spent in each area of the elevated zero maze. Heat map shows more time spent in the closed arms than in the open arms. All data represented as mean ± SEM.
FIGURE 3
FIGURE 3. pnVTAPNOC neuron activity is recruited in response to predatory threat.
A Cartoon of DIO-GCaMP6s (GCaMP6s) injection and fiber implant into pnVTA of PNOC-Cre mice. GCaMP6s activity was recorded during looming or exposure to predator odor. B Averaged traces of pnVTAPNOC GCaMP6s activity for males (blue, N = 5 mice) and females (magenta, N = 7 mice) aligned to looming onset. C Area under the curve (AUC) for averaged traces from B for females (left, magenta) and males (right, blue), calculated over 5-second intervals. GCaMP6s activity increases during and immediately after looming in males, but not females (2-way ANOVA with Tukey’s multiple comparisons test, **p < 0.01, *p < 0.05, N = 5 males, 7 females). D Left: Averaged traces of pnVTAPNOC GCaMP6s activity surrounding 30-second exposure to either predator odor (2% 2MT, green) or a control non-predator odor (2% peppermint oil, blue). Right: Heat map of GCaMP6s fluorescence during same epoch, each row correspond to a trial in the averaged trace (left). (N = 10 mice). E AUC for averaged traces from D calculated over 10-second intervals surrounding exposure to either the 2MT predator odor (left, green) or the peppermint oil (right, blue). pnVTAPNOC GCaMP6s activity increases during 2MT but not peppermint oil exposure (2-way ANOVA with Tukey’s multiple comparisons test, ****p < 0.0001, **p < 0.01, *p < 0.05, N = 10 mice). All data represented as mean ± SEM.
FIGURE 4
FIGURE 4. GABA and glutamatergic projections from the lateral hypothalamus provide input onto pnVTAPNOC neurons.
A Cartoon of bilateral CaMKII-ChR2-eYFP injection into lateral hypothalamus (LH) and DIO-mCherry injection into pnVTA of PNOC-Cre mice. B Schematic for voltage-clamp recordings of oIPSCs or oEPSCs from LHGABA and LHGlut terminals in the pnVTA. C Example trace and effect of 50 μM picrotoxin on oIPSC amplitude recorded from pnVTAPNOC neurons (n = 16, N = 3). D Optically-evoked input/output curve of oIPSCs recorded from pnVTAPNOC neurons at increasing LED stimulation intensities (n = 16, N = 3). E Example trace and effect of 10 μM CNQX on oEPSC amplitude recorded from pnVTAPNOC neurons (n = 16, N = 3). F Optically-evoked input/output curve of oEPSCs recorded from pnVTAPNOC neurons at increasing LED stimulation intensities (n = 16, N = 3). G Summary of excitatory and inhibitory responses to LH terminal stimulation from all recorded pnVTAPNOC neurons. H Maximum oIPSC amplitude vs maximum oEPSC amplitude recorded from pnVTAPNOC neurons. Nonlinear regression using a least squares fit (purple line) and null hypothesis (no GABA or glutamate amplitude bias, dashed line) are shown. (n = 16 cells per group, ****p < 0.0001). I Paired pulse ratio (PPR) of oIPSCs from LHGABA inputs (red) and oEPSCs from LHGlut inputs (blue) (n = 6–7 cells per group; two-tailed t-test, p = 0.0607).

References

    1. Brown SA, Vik PW, Patterson TL, Grant I, Schuckit MA. Stress, vulnerability and adult alcohol relapse. Journal of Studies on Alcohol. 1995;56(5):538–545. doi: 10.15288/jsa.1995.56.538 - DOI - PubMed
    1. Pittenger C, Duman RS. Stress, Depression, and Neuroplasticity: A Convergence of Mechanisms. Neuropsychopharmacology. 2008;33(1):88–109. Bandiera_abtest: a Cg_type: Nature Research Journals Number: 1 Primary_atype: Reviews Publisher: Nature Publishing Groupdoi: 10.1038/sj.npp.1301574 - DOI - PubMed
    1. Kosten TR, Gawin FH, Rounsaville BJ, Kleber HD. Cocaine abuse among opioid addicts: demographic and diagnostic factors in treatment. The American Journal of Drug and Alcohol Abuse. 1986;12(1–2):1–16. doi: 10.3109/00952998609083739 - DOI - PubMed
    1. Steel Z, Marnane C, Iranpour C, et al. The global prevalence of common mental disorders: a systematic review and meta-analysis 1980–2013. International Journal of Epidemiology. 2014;43(2):476–493. doi: 10.1093/ije/dyu038 - DOI - PMC - PubMed
    1. Szczepanik JE, Furey ML, Nugent AC, Henter ID, Zarate CA, Lejuez CW. Altered interaction with environmental reinforcers in major depressive disorder: Relationship to anhedonia. Behaviour Research and Therapy. 2017;97:170–177. doi: 10.1016/j.brat.2017.08.003 - DOI - PMC - PubMed

Publication types

LinkOut - more resources