[Preprint]. 2025 Apr 8:2025.04.07.647691.
doi: 10.1101/2025.04.07.647691.

Isotope tracing-based metabolite identification for mass spectrometry metabolomics

Affiliations

Isotope tracing-based metabolite identification for mass spectrometry metabolomics

Deniz Secilmis et al. bioRxiv. .

Abstract

Modern mass spectrometry-based metabolomics is a key technology for biomedicine, enabling discovery and quantification of a wide array of biomolecules critical for human physiology. Yet, only a fraction of human metabolites have been structurally determined, and the majority of features in typical metabolomics data remain unknown. To date, metabolite identification relies largely on comparing MS2 fragmentation patterns against known standards, related compounds or predicted spectra. Here, we propose an orthogonal approach to identification of endogenous metabolites, based on mass isotopomer distributions (MIDs) measured in an isotope-labeled reference material. We introduce a computational measure of pairwise distance between metabolite MIDs that allows identifying novel metabolites by their similarity to previously known peaks. Using cell material labeled with 20 individual 13C tracers, this method identified 62% of all unknown peaks, including previously never seen metabolites. Importantly, MID-based identification is highly complementary to MS2-based methods in that MIDs reflect the biochemical origin of metabolites, and therefore also yields insight into their synthesis pathways, while MS2 spectra mainly reflect structural features. Accordingly, our method performed best for small molecules, while MS2-based identification was stronger on lipids and complex natural products. Among the metabolites discovered was trimethylglycyl-lysine, a novel amino acid derivative that is altered in human muscle tissue after intensive lifestyle treatment. MID-based annotation using isotope-labeled reference materials enables identification of novel endogenous metabolites, extending the reach of mass spectrometry-based metabolomics.


Conflict of interest statement

Competing interests J.W. and M.J. are employees at Sapient Bioanalytics, and hold equity in the company. The other authors declare no competing interests.

Figures

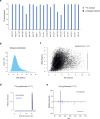
Extended Data Figure 1
a, Distribution of 13C enrichment in 721 LCMS peaks in cells labeled with U-13C-glucose and in unlabeled cells. b, Chromatograms of peak 582 in cell extracts and a pure UDP-glucuronate standard. c, MS2 fragmentation spectra of peak 582 in cell extracts and a pure UDP-glucuronate standard.
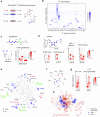
Extended Data Figure 2
a, 13C enrichment of the indicated metabolites in the 20 corresponding U-13C-labeled media and in unlabeled medium. b, distribution of pairwise MID distances based on all tracers combined, corresponding to Fig 2e. c, scatter plot of MID distances vs. corresponding projected UMap distances. Line of identity indicated in blue. d, Chromatograms of peak 1171 in cell extracts and a pure citryl-glutamate standard. e, MS2 fragmentation spectra of peak 1171 in cell extracts and a pure citryl-glutamate standard.
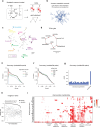
Extended Data Figure 3
a, Time course of 3,097 mass isotopomer (MI) fractions in 404 simulated metabolites with U-13C-glucose as the labeled substrate. Dashed line indicates sampled time point. b, Histogram of the fraction f of derived carbons for all metabolite pairs, in either the same or different pathway. c, Variation in area under the precision-recall curve (AUPR) for MID distances computed from all experiments combined, for 100 random metabolite subsets of indicated sizes. d, AUPR of MID distances when iteratively adding next-best experiment. Experiments chosen in the first few iterations are indicated.
Extended Data Figure 4
a, Heatmap of mass isotopomer (MI) fractions of 183 putative lipids (bottom) and their predicted number of carbons (top). b, Distribution of number of putative annotations per peak when matching by m/z against HMDB. c-e, UMap projections of neighbors of peaks 5579 (c), 2147 (d) and 5128 (e) according to the MID distance. Nearby known compounds indicated in blue. f-g, Validation of predicted peak identities 4889 aspartylglucosamine (f), 5579 nicotinamide riboside (g), 2147 N-acetylthreonine (h) and 5128 N-acetyl-asparatylglutamate (i) by retention time and MS2 fragmentation spectra of the corresponding pure standards. j-l, UMap projections of neighbors of peaks 5872 (j), 5450 (k) and 6133 (l) according to the MID distance, and corresponding MIDs for experiments with substantial 13C labeling.
Extended Data Figure 5
a-b, MS2 spectra of peak 5665 in cell extract and of pure standards for trimethyllysyl-glycine (a) and glycyl-trimethyllysine (b). c, MS2 spectra of peak 5665 in cell extract and of a pure trimethylglycyl-lysine (TMGL) standard. Predicted structures and theoretical m/z for indicated ions are shown, with colors indicating origin of carbons from lys, gly and met. d, chromatograms of peak 5665 in cell extract and a pure TMGL standard. e, MS2 spectrum of a 13C11-TMGL peak in cells cultured in “deep labeling” medium, where all amino acids and glucose are U-13C. Numbers refer to ion structures in (c). Mass isotopomer shifts indicated in parentheses. f, MS2 spectrum of a 13C6-TMGL peak in cells cultured in U-13C6-lysine medium, as in (e).
Extended Data Figure 6
a, chromatograms of indicated mass isotopomers of trimethylglycine (TMG; also known as betaine) in HMECs cultured in U-13C-methionine medium. b, M+3 mass isotopomer fractions of TMG and TMGL in MCF7 cells cultured in methyl-13C3-choline medium. c, relative abundance of TGML in medium incubated with and without HMECs. d, chromatograms of TMGL from human plasma and skeletal muscle samples. e, MS2 spectrum of the TMGL peak in a human skeletal muscle sample. f, relative abundance of TMGL in human skeletal muscle before and after standard care (control group).
Figure 1
Figure 1. Principle of MID-based metabolite identification.
a, Mass isotopomer distributions (MIDs) of citrate and aconitate in cell extracts. Blue dots indicate carbon atoms. MI, mass isotopomer. b, MIDs of glucose-6-phosphate, uridine-diphosphate (UDP) and UDP-glucose in cells, as well as predicted convolution MID (left). Red and blue dots indicate transferred carbon atoms. c, schematic for computation of the MID distance between hypothetical molecules A and B with convolutants C1, C2 and C3. Circles indicate carbon atoms; bar graphs indicate MIDs. The MID distance between A and B equals the Euclidean distance between the best matching convolution A + C2 and B (middle row). d, MID distances between UDP-glucose and 721 putative metabolites. e, zoom in on the region indicated in gray in (d), with predicted (black) and previously known (blue) compounds indicated. Error bars in (a, b) indicate standard deviation from n = 3 independent cultures.
Figure 2
Figure 2. MID-based metabolite identification from multiple tracers.
a, schematic of parallel isotope labeling experiments. Each experiment may label a different moiety of a compound of interest. b, Heatmap of 13C enrichment in 721 putative metabolites from 13C labeling experiments in cell extracts with indicated substrates. glc, glucose; control, unlabeled (12C) control culture. c, Glutathione structure (top), simplified scheme of glutathione synthesis (left), and MIDs of glutathione across labeling experiments (right), shown as a heat map of mass isotopomer (MI) fractions. Experiments with substantial 13C labeling are shown. d, Structure of inosine with origin of carbons indicated by color, and MIDs of hypoxantine (hxan), ribose-phosphate, their computed convolution, and inosine. e, UMap projection of all pairwise MID distances between 721 putative metabolites, with clusters of related metabolites highlighted. sam, S-adenosylmethionine; argsuc, argininosuccinate. f, zoom in on region of (e) with TCA cycle and glutamate-related metabolites indicated. g, MIDs of peak 1171 (citryl-glutamate) and the convolution of glutamate and citrate. h, Overlaid networks derived from MID-based distance (d < 0.7) and MS2-based molecular networking. Lipids (amphipathic) and polar compounds are indicated. z
Figure 3
Figure 3. Computational evaluation of the MID distance.
a, simple example of simulation study, where a metabolic network is used to simulate MIDs of metabolites B and D using labeled substrates A and C, and also to compute a “gold standard” for pairwise biochemical relatedness (see Methods). b, atom-level connectivity structure and summary statistics for the human metabolite network model used. c, UMap projection of MID distances from simulated data, from all experiments combined. Groups of related metabolites are highlighted. The creatine cluster was far separated and is shown as an inset. d, Local UMap projections of the TCA cycle, with lines indicating known biochemical reactions. e, Precision-recall curves for accuracy of the MID distance, compared to the gold standard derived from the human metabolic network, at indicated sampling noise levels. f, Precision-recall curves as in (f) on random metabolite subsets, simulating incomplete measurements. g, Area under the precision-recall curve (AUPR) for MID distances computed from each individual experiment and from all experiments combined. h, median rank by MID distance of the true neighbors of each metabolite; gray, ranks of randomly chosen neighbors. i, clustered heat map of ranks as in (i), for MID distances computed from each individual experiment, and from all experiments combined. Selected metabolite groups are indicated.
Figure 4
Figure 4. Systematic evaluation of MID-based metabolite identification.
a, Peaks in the HMEC data categorized as previously known; unknown lipids, and unknown polar compounds. b, UMap projection of the neighbors of peak 4889 (circled) according to the MID distance. Nearby known compounds indicated in blue. c, number and fraction of unknown lipids and polar metabolites determined by MID-based and MS2-based metabolite identification. n.d, not determined. d, UMap projection and MIDs of unknown 6174 and 6284, consistent with a spermidine-related structure (bottom). e, chromatograms of peaks coeluting with glutamine (relative intensity), with m/z (left) and 13C enrichment from relevant labeling experiments shown as heatmaps.
Figure 5
Figure 5. Discovery of the human metabolite trimethylglycyl-lysine (TMGL).
a, UMap projection of the neighbors of peak 5665. b, MIDs of trimethyllysine (tmlys), glycine (gly), their convolution (tmlys + gly) and peak 5665. Experiments with substantial 13C labeling are shown. c, Putative synthesis pathway of TMGL from lysine, glycine and methionine. d, MS2 spectra of TMGL peak from cells labeled with 13C-methionine, showing expected 13C labeling of fragments containing methyl groups. e, Relative abundance of indicated TMGL indicated mass isotopomers, normalized to M+0 apex, in cells labeled with U-13C-serine or U-13C-methionine for indicated time periods. Numbers indicate MI fraction. g, Relative abundance of TMGL in human skeletal muscle before and after intensive lifestyle therapy (ILT).

References

    1. Wang-Sattler R. et al. Novel biomarkers for pre-diabetes identified by metabolomics. Molecular Systems Biology 8, 615 (2012). - PMC - PubMed
    1. Stewart N. A., Buch S. C., Conrads T. P. & Branch R. A. A UPLC-MS/MS assay of the “Pittsburgh cocktail”: six CYP probe-drug/metabolites from human plasma and urine using stable isotope dilution. Analyst 136, 605–612 (2011). - PMC - PubMed
    1. Buergel T. et al. Metabolomic profiles predict individual multidisease outcomes. Nat Med 28, 2309–2320 (2022). - PMC - PubMed
    1. da Silva R. R., Dorrestein P. C. & Quinn R. A. Illuminating the dark matter in metabolomics. Proceedings of the National Academy of Sciences 112, 12549–12550 (2015). - PMC - PubMed
    1. Mahieu N. G. & Patti G. J. Systems-Level Annotation of a Metabolomics Data Set Reduces 25 000 Features to Fewer than 1000 Unique Metabolites. Analytical Chemistry 89, 10397–10406 (2017). - PMC - PubMed

Publication types

LinkOut - more resources