

Hemidiaphragm work in large pleural effusion and its insignificant impact on blood gases: a new insight based on in silico study
- PMID: 40292005
- PMCID: PMC12021632
- DOI: 10.3389/fphys.2025.1539781
Hemidiaphragm work in large pleural effusion and its insignificant impact on blood gases: a new insight based on in silico study
Abstract
Objective: Computer simulations, enabling observations of variables inaccessible in living patients, provide a powerful approach to studying complex physiological phenomena. This in silico study presents the use of a virtual patient to investigate the impact of large pleural effusion (PE) and therapeutic thoracentesis (TT) on hemidiaphragm function and arterial blood gases.
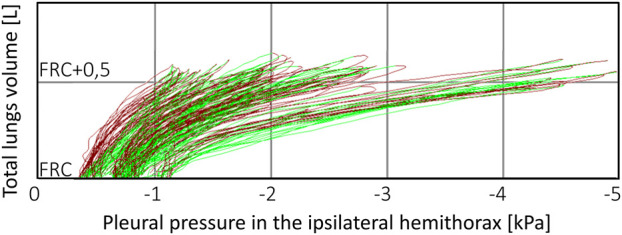
Methods: Inspired by unexpected phenomena observed in living patients undergoing large-volume TT, we formulated four questions regarding this impact. To answer these questions, we simulated right-sided PE in our virtual patient and studied changes in the pleural pressure in the ipsilateral hemithorax (Ppli) and lung volume during the respiratory cycle (exemplified by Ppli-V loops, where V is the volume of both lungs), airflows in the main bronchi, and alveolar O2 (PAO2) and CO2 (PACO2) partial pressures.
Results: Simulations highlighted that: (a) mediastinal compliance critically affects hemidiaphragm work; (b) the 8-shaped Ppli-V loops are associated with hemidiaphragm inversion, where exhalation from the ipsilateral lung occurs during a part of both the inspiratory and expiratory phases, and vice versa; (c) pre-TT PAO2 may be elevated due to reduction of the tidal volume to end-expiratory lung volume ratio; and (d) pre-TT Ppli amplitudes during respiration can exceed post-TT values when mediastinal compliance is high.
Conclusion: Our findings emphasize the significance of mediastinal compliance in pleural effusion physiology and suggest insignificant influence of the ipsilateral hemidiaphragm inverted due to large PE on arterial gas tensions. This study underscores the utility of virtual patient models for elucidating unexpected physiological behaviors and optimizing clinical interventions.
Keywords: arterial blood gases; hemidiaphragm function; hemidiaphragm inversion; in silico study; large pleural effusion; pendulum breathing; therapeutic thoracentesis; virtual patient.
Copyright © 2025 Gólczewski, Stecka, Grabczak, Michnikowski, Zielińska-Krawczyk and Krenke.
Conflict of interest statement
The authors declare that the research was conducted in the absence of any commercial or financial relationships that could be construed as a potential conflict of interest.
Figures


Similar articles
-
Changes in pulmonary mechanics and gas exchange after thoracentesis on patients with inversion of a hemidiaphragm secondary to large pleural effusion.Chest. 1995 Jun;107(6):1610-4. doi: 10.1378/chest.107.6.1610. Chest. 1995. PMID: 7781355
-
The use of a virtual patient to follow changes in arterial blood gases associated with therapeutic thoracentesis.Int J Artif Organs. 2018 Nov;41(11):690-697. doi: 10.1177/0391398818793354. Epub 2018 Aug 24. Int J Artif Organs. 2018. PMID: 30141367
-
Impact of therapeutic thoracentesis and pleural pressure changes on breathing pattern, dyspnea, lung function, and arterial blood gases.Pol Arch Intern Med. 2022 Apr 28;132(4):16185. doi: 10.20452/pamw.16185. Epub 2022 Jan 4. Pol Arch Intern Med. 2022. PMID: 34985233
-
Ventilatory response to exercise in cardiopulmonary disease: the role of chemosensitivity and dead space.Eur Respir J. 2018 Feb 7;51(2):1700860. doi: 10.1183/13993003.00860-2017. Print 2018 Feb. Eur Respir J. 2018. PMID: 29437936 Review.
-
[Gas exchange in acute respiratory distress syndrome].Medicina (B Aires). 2003;63(2):157-64. Medicina (B Aires). 2003. PMID: 12793087 Review. Spanish.
References
-
- Bodtger U., Hallifax R. J. (2020). Pleural disease. Chapter 1. Sheffield: ERS.
-
- Fitzgerald D. B., Muruganandan S., Peddle-McIntyre C. J., Lee Y. C. G., Singh B. (2022). Ipsilateral and contralateral hemidiaphragm dynamics in symptomatic pleural effusion: the 2nd pleural effusion and symptom evaluation (PLEASE-2) study. Respirology 27 (10), 882–889. 10.1111/resp.14307 - DOI - PubMed
LinkOut - more resources
Full Text Sources