. 2025 Apr;30(4):045001.
doi: 10.1117/1.JBO.30.4.045001. Epub 2025 Apr 25.

Frequency domain broadband short-wave infrared spectroscopy for measurement of tissue optical properties from 685 to 1300 nm

Affiliations

Frequency domain broadband short-wave infrared spectroscopy for measurement of tissue optical properties from 685 to 1300 nm

Diana Suciu et al. J Biomed Opt. 2025 Apr.

Abstract

Significance: Extending frequency domain diffuse optical spectroscopy (FD-DOS) into the short-wave infrared (SWIR) region has the potential to improve measurements of key biological tissue chromophores such as water and lipids, given their higher absorption in SWIR compared with near-infrared wavelengths. Few studies have explored FD-DOS in the SWIR range.

Aim: We present the first demonstration of a frequency domain broadband SWIR spectroscopy (FD-Bb-SWIRS) system to measure optical properties from 685 to 1300 nm.

Approach: A custom hybrid system was developed, combining discrete frequency domain measurements from 685 to 980 nm with broadband continuous wave measurements from 900 to 1300 nm. This setup provided absolute absorption ( μ a ) spectra from 685 to 1300 nm. Validation was performed using mineral oil-based solid phantoms, deuterium oxide ( D 2 O ) liquid phantoms, and desiccating porcine tissue.

Results: The FD-Bb-SWIRS system was sensitive to changes in μ a from varying concentrations of absorbers in solid and liquid phantoms. Ex vivo measurements of μ a spectra indicated differences in tissue water content across different porcine tissue samples during baseline and desiccation.

Conclusions: FD-Bb-SWIRS is highly sensitive to μ a in the 685 to 1300 nm range and enables precise quantification of water in biological tissues. It represents a significant step forward in advancing SWIR-based optical spectroscopy for clinical applications.

Keywords: absorption spectra; diffuse optics; lipids; shortwave infrared light; water.


Figures

Fig. 1
Fig. 1
Spectra of absorption coefficients (μa) and the resulting reduced scattering coefficient (μs) for four dominant chromophores (oxyhemoglobin HbO2, deoxyhemoglobin Hb, water, and lipids) of human tissue. The total μa is calculated by adding the individual chromophore absorptions to get the human tissue absorption spectra. The region with white background indicates the NIR spectrum (650 to 1000 nm). The shaded region indicates the SWIR spectrum (1000 nm and longer). These plots are generated from values obtained from typical muscle tissue chromophore concentrations, such as total hemoglobin ([HbT])=117  μM, oxygen saturation (StO2)=65%, [water] = 60%, [lipid] = 20%), μs  (500  nm)=1.5  mm1, and scattering power b=0.9. The sources of extinction coefficients used to generate this figure are listed in the Appendix.
Fig. 2
Fig. 2
Schematic diagram of the custom FD-Bb-SWIRS system. Key components include the following: ADC, analog-to-digital converter; APD, avalanche photodiode; DC, direct current; DDS, direct digital synthesizer; LPF, low-pass filter; Amp, amplifier; BPF, bandpass filter. FD sources (730, 830, 940, and 980 nm) and FD detector are indicated by red lines, and CW source and detector are indicated by blue lines.
Fig. 3
Fig. 3
(a) Adjustable probe containing the FD and CW source and detector fibers set to an SDS of 10 mm. (b) FD-Bb-SWIRS system. The black enclosure houses the electronic system which is controlled by a laptop.
Fig. 4
Fig. 4
Processing pipeline of the FD-Bb-SWIRS system that combines FD-NIRS and broadband CW-SWIRS systems. Note that λ0=900  nm for the scattering power law fit.
Fig. 5
Fig. 5
Example FD-Bb-SWIRS measurements of a liquid intralipid phantom composed of 1.5% lipid by volume calibrated against a 1% lipid by volume calibration liquid intralipid phantom. The FDNIRS μa (a) and μs (b) are overlaid with the respective CW-SWIRS spectra.
Fig. 6
Fig. 6
(a) and (b) Photos of the two porcine samples, muscle (M) sample and muscle with an adipose layer (M+A) sample. Photos were taken at baseline (before desiccation).
Fig. 7
Fig. 7
Uncertainties in absorption (μa) and reduced scattering (μs) properties obtained from simulations with FD reflectance data. Optical property examples are shown for human muscle tissue at 800 nm (μa=0.02  mm1, μs=1  mm1, shown as a red “o” symbol) and 1200 nm (μa=0.11  mm1, μs=0.6  mm1, shown as a red “x” symbol). These plots are generated from values obtained from typical muscle tissue chromophore concentrations (total hemoglobin ([HbT])=117  μM, oxygen saturation (StO2)=65%, [water]=60%, and [lipid] = 20%) and scattering parameters (μs(500  nm)=1.5  mm1, b=0.9).
Fig. 8
Fig. 8
Spectra of (a) μa and (b) μs of three solid mineral oil–based phantoms with carbon black concentrations at 0.05, 0.08, and 0.16  g/L. Values of μa (c) and μs (d) at 685, 852 (from FD measurements), 925, and 1210 nm (from broadband extrapolated values) versus the different carbon black concentrations in the phantoms. Lines in panels (c) and (d) indicate the linear fits across all data points.
Fig. 9
Fig. 9
Spectra of (a) μa and (b) μs of the 10 titration steps. The titration was performed from 0% D2O to 90% D2O. Values of μa (c) and (d) μs at 730, 852 (from FD measurements), 980, and 1200 nm (from broadband measurements) versus the different D2O concentrations. Lines in panels (c) and (d) indicate the linear fits over all data points.
Fig. 10
Fig. 10
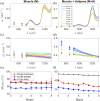
Optical properties and water extraction results for two porcine tissues: a muscle (M) sample and a muscle with adipose layer (M+A) sample. Data were collected every hour over an 8-h desiccation period. Absorption (μa) spectra (a) and (b) and reduced scattering (μs) spectra (c) and (d) are presented for each desiccation hour, with values shown as means and standard errors based on three separate location measurements. Panels (e) and (f) show the extracted water concentrations (water) over time for both samples, derived from weight estimates, FD-Bb-SWIRS optical data, and FD-Bb-NIRS optical data (up to 1000 nm). The results are shown with means and standard errors from measurements taken at three distinct locations.

Similar articles

References

    1. Durduran T., et al. , “Diffuse optics for tissue monitoring and tomography,” Rep. Prog. Phys. 73(7), 076701 (2010).RPPHAG10.1088/0034-4885/73/7/076701 - DOI - PMC - PubMed
    1. Applegate M. B., et al. , “Recent advances in high speed diffuse optical imaging in biomedicine,” APL Photonics 5(4), 040802 (2020).10.1063/1.5139647 - DOI
    1. Scholkmann F., et al. , “A review on continuous wave functional near-infrared spectroscopy and imaging instrumentation and methodology,” Neuroimage 85, 6–27 (2014).NEIMEF10.1016/j.neuroimage.2013.05.004 - DOI - PubMed
    1. Tao R., et al. , “Tutorial on methods for estimation of optical absorption and scattering properties of tissue,” J. Biomed. Opt. 29(6), 060801 (2024).JBOPFO10.1117/1.JBO.29.6.060801 - DOI - PMC - PubMed
    1. Fantini S., Sassaroli A., “Frequency-domain techniques for cerebral and functional near-infrared spectroscopy,” Front. Neurosci. 14, 300 (2020).10.3389/fnins.2020.00300 - DOI - PMC - PubMed

Publication types