. 2025 Jul;24(7):e70081.
doi: 10.1111/acel.70081. Epub 2025 Apr 28.

Age-Associated Decline in Autophagy Pathways in the Retinal Pigment Epithelium and Protective Effects of Topical Trehalose in Light-Induced Outer Retinal Degeneration in Mice

Affiliations

Age-Associated Decline in Autophagy Pathways in the Retinal Pigment Epithelium and Protective Effects of Topical Trehalose in Light-Induced Outer Retinal Degeneration in Mice

Katherine Cox et al. Aging Cell. 2025 Jul.

Abstract

Age is a primary risk factor for chronic conditions, including age-related macular degeneration (AMD). Impairments in autophagy processes are implicated in AMD progression, but the extent of autophagy's contribution and its therapeutic potential remain ambiguous. This study investigated age-associated transcriptomic changes in autophagy pathways in the retinal pigment epithelium (RPE) and evaluated the protective effects of topical trehalose, an autophagy-enhancing small molecule, against light-induced outer retinal degeneration in mice. Transcriptomic analysis of human RPE/choroid and mouse RPE revealed consistent downregulation of autophagy pathways with age, alongside variable changes as AMD severity progressed. Given the age- and AMD-associated perturbation of autophagy pathways, we examined trehalose treatment in vitro, which enhanced autophagic flux and restored mitochondrial respiratory function in primary murine RPE cells exposed to oxidative stress. In vivo, topical trehalose improved autophagy-lysosome activity in mouse RPE, as demonstrated by elevated LC3B turnover and SQSTM1/p62 degradation. Furthermore, trehalose eyedrops protected mice from light-induced damage to the RPE and photoreceptors, preserving outer nuclear layer thickness, RPE morphology, and junctional F-actin organization. Taken together, the data support that age-related decline and severe dysregulation in autophagy contributed to AMD progression. By restoring autophagic flux, topical trehalose demonstrates therapeutic potential to address early autophagy-related pathological changes in AMD.

Keywords: aging; autophagy; oxidative stress; retinal degeneration; retinal pigment epithelium; topical administration; trehalose.


Conflict of interest statement

The authors declare no conflicts of interest.

Figures
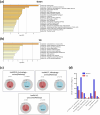
FIGURE 1
FIGURE 1
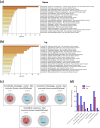
Predominant downregulation of autophagy‐lysosomal pathways in aged human RPE/choroid. (a, b) Top enriched KEGG pathways of downregulated (a) and upregulated (b) genes identified through a linear analysis of RNA‐seq data from macular RPE/choroid samples of 36 normal controls aged 50–94 years (mean 70.5 ± 13.6, mixed gender) (Orozco et al. 2023). Pathway enrichment analysis was conducted using the Metascape platform with default setting: p cutoff = 0.01, minimum overlap = 3, and minimum enrichment = 1.5. (c) Membership analysis conducted through Metascape for upregulated (left) and downregulated (right) genes enriched in specific KEGG pathway terms, including Autophagy (hsa04140), Mitophagy (hsa04137), and lysosome (hsa04142). The outer circle represents the percentage and number of total genes associated with the pathway, while the inner circle shows the percentage and number of input genes mapping to the pathway. The P‐value above the pie chart indicates the statistical significance of the gene set membership to the pathway term. (d) Number of downregulated (blue) and upregulated (red) genes in each category based on a broader autophagy‐lysosome gene list (Bordi et al. 2021).
FIGURE 2
FIGURE 2
Volcano plot and PaGenBase enrichment of DEGs in aged mouse RPE. RPE cells isolated from eyes of 5‐ and 22‐month‐old male C57BL/6J mice (n = 6 eyes per group) were subjected to RNA‐seq analysis. (a) The volcano plot displays significantly downregulated (blue) and upregulated (red) DEGs, with the number of DEGs indicated. Statistical thresholds were set at padj < 0.05 and |log2FC| > 0.25. Genes without significant changes are presented in gray. (b) PaGenBase enrichment analysis, performed via Metascape, illustrates cell and tissue specificity of downregulated and upregulated DEGs. The entire genome was used as the enrichment background. Terms with p cutoff = 0.01, minimum overlap = 3, and minimum enrichment = 1.5 were identified and grouped into clusters based on membership similarities.
FIGURE 3
FIGURE 3
Predominant downregulation of autophagy‐lysosomal pathways in aged mouse RPE. (a, b) Top enriched KEGG pathways of downregulated (a) and upregulated (b) DEGs identified through RNA‐seq analysis of RPE cells isolated from 5‐ and 22‐month‐old male C57BL/6J mice (n = 6 per group). Pathway enrichment analysis was conducted using the Metascape platform with default setting: p cutoff = 0.01, minimum overlap = 3, and minimum enrichment = 1.5. (c) Membership analysis conducted through Metascape for upregulated (left) and downregulated (right) genes enriched in specific KEGG pathway terms, including Autophagy (mmu04140), Mitophagy (mmu04137), and lysosome (mmu04142). The outer circle represents the percentage and number of total genes associated with the pathway, while the inner circle shows the percentage and number of input genes mapping to the pathway. The p‐value above the pie chart indicates the statistical significance of the gene set membership to the pathway term. (d) Number of downregulated (blue) and upregulated (red) genes in each category based on a broader autophagy‐lysosome gene list (Bordi et al. 2021).
FIGURE 4
FIGURE 4
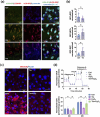
Trehalose effects in inducing autophagy flux and protecting mitochondrial activity against oxidative stress in primary murine RPE cells. (a) Confocal images of untreated RPE cells (top), and RPE cells treated with chloroquine (CQ, 50 μM, middle) or trehalose (12.5 mM, bottom) showing LC3B tandem tracker‐stained autophagosome (LC3B‐GFP, Green) and autolysosome (LC3B‐RFP, Red), Lysotracker‐stained lysosome (Blue) and Hoescht‐stained nuclei (Cyan). (b) Quantification of autophagosomes (GFP + RFP‐ vacuoles), autolysosomes (GFP‐RFP+ vacuoles), and autophagy flux (RFP:GFP ratio, bottom) in trehalose‐treated RPE cells (n = 9), compared to control cells (n = 14). (c) Confocal images of MitoSox staining (red) in untreated RPE cells (top left), and RPE cells treated with trehalose (12.5 mM, top right), H2O2 (60 μM, bottom left), or a combination of both (bottom right). Hoescht staining in blue. (d) Oxygen consumption rate (OCR) profile (top) and basal respiration (BR) and maximal respiration (MR) parameters (bottom) of RPE cells treated with trehalose, H2O2, or their combination, compared to untreated cells (n = 3). Comparison by Mann Whitney test for GFP + RFP‐ (nonnormal data), Welch's tests for GFP‐RFP+ and RFP:GFP (normal data with unequal variances) (b), or two‐way ANOVA with Bonferroni tests for OCR parameter analysis (d). *p < 0.05; **p < 0.01; ns, nonsignificant.
FIGURE 5
FIGURE 5
Modulation of markers of autophagy activity in murine RPE with topical trehalose application. (a) Representative confocal images of LC3B (red) and LAMP1 (blue) staining in retinal sections. Merge channel shows nuclei in gray, and colocalization between LC3B and LAMP1 in magenta at the RPE layer. Boxed areas indicate part of the RPE region of interest. (b) Representative confocal images of p62 (green) staining in retinal sections. Merge channel shows nuclei in gray. Scale bar = 50 μm. (c) Quantification for the mean fluorescence intensity (MFI) of LC3B, LAMP1 and p62 signals in 3 different fields at the RPE region from each section (PBS: N = 6; Tre: N = 5). Comparison by Student's t‐tests for LC3B, LAMP1 and p62 (all normal data with equal variances) (c). *p < 0.05; **p < 0.01.
FIGURE 6
FIGURE 6
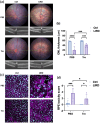
Protective effects of topical trehalose pre‐treatment in a murine model of light‐induced outer retinal degeneration. (a) Representative fundus (top) and OCT (bottom) images comparing PBS‐treated (top row) and trehalose‐treated (bottom row) eyes, captured 7 days post‐light challenge. The green line demarks the scan line for corresponding OCT images. One‐time light exposure (right column) was applied to the left eyes after 7 days of pre‐treatment with either PBS or trehalose, followed by continued application for an additional 7 days before tissue harvest. Right eyes without light challenge served as undamaged controls (left column). (b) Quantification of averaged outer nuclear layer (ONL) thickness across the four groups (n = 7) was performed in a blinded manner. (c) Representative confocal images of RPE flatmounts displaying F‐Actin junction staining (magenta) and nuclei (cyan). Scale bar = 50 μm. (d) Scoring of RPE toxicity using an established protocol in a blinded manner (n = 5). Comparisons by two‐way ANOVA with Holm‐Šídák tests (b, d). *p < 0.05; ***p < 0.001; ****p < 0.0001.

Similar articles

References

    1. Ambati, J. , and Fowler B. J.. 2012. “Mechanisms of Age‐Related Macular Degeneration.” Neuron 75, no. 1: 26–39. 10.1016/j.neuron.2012.06.018. - DOI - PMC - PubMed
    1. Baker, A. E. , Mantz A. R., and Chiu M. L.. 2014. “Raman Spectroscopy Characterization of Antibody Phases in Serum.” MAbs 6, no. 6: 1509–1517. 10.4161/19420862.2014.975100. - DOI - PMC - PubMed
    1. Bjornson, K. J. , Vanderplow A. M., Bhasker A. I., and Cahill M. E.. 2024. “Increased Regional Activity of a Pro‐Autophagy Pathway in Schizophrenia as a Contributor to Sex Differences in the Disease Pathology.” Cell Reports Medicine 5, no. 7: 101652. 10.1016/j.xcrm.2024.101652. - DOI - PMC - PubMed
    1. Bordi, M. , De Cegli R., Testa B., Nixon R. A., Ballabio A., and Cecconi F.. 2021. “A Gene Toolbox for Monitoring Autophagy Transcription.” Cell Death & Disease 12, no. 11: 1044. 10.1038/s41419-021-04121-9. - DOI - PMC - PubMed
    1. Cagini, C. , Torroni G., Mariniello M., Di Lascio G., Martone G., and Balestrazzi A.. 2021. “Trehalose/Sodium Hyaluronate Eye Drops in Post‐Cataract Ocular Surface Disorders.” International Ophthalmology 41, no. 9: 3065–3071. 10.1007/s10792-021-01869-z. - DOI - PMC - PubMed

MeSH terms

LinkOut - more resources