. 2025 Apr 28;82(1):178.
doi: 10.1007/s00018-025-05695-9.

Muscle mTOR controls iron homeostasis and ferritinophagy via NRF2, HIFs and AKT/PKB signaling pathways

Affiliations

Muscle mTOR controls iron homeostasis and ferritinophagy via NRF2, HIFs and AKT/PKB signaling pathways

Agnès Conjard-Duplany et al. Cell Mol Life Sci. .

Abstract

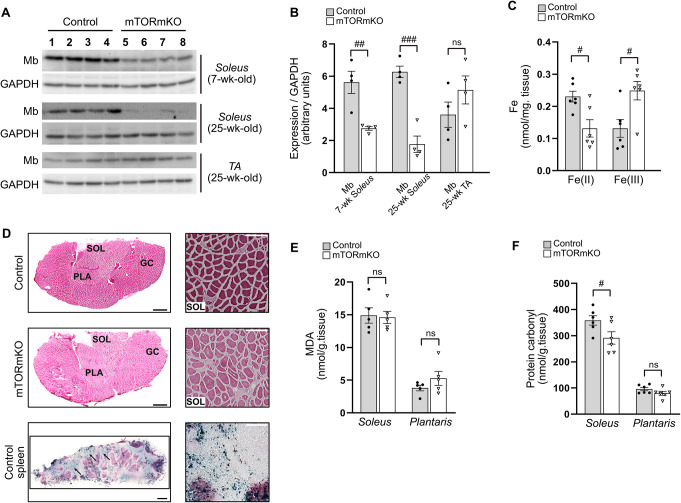
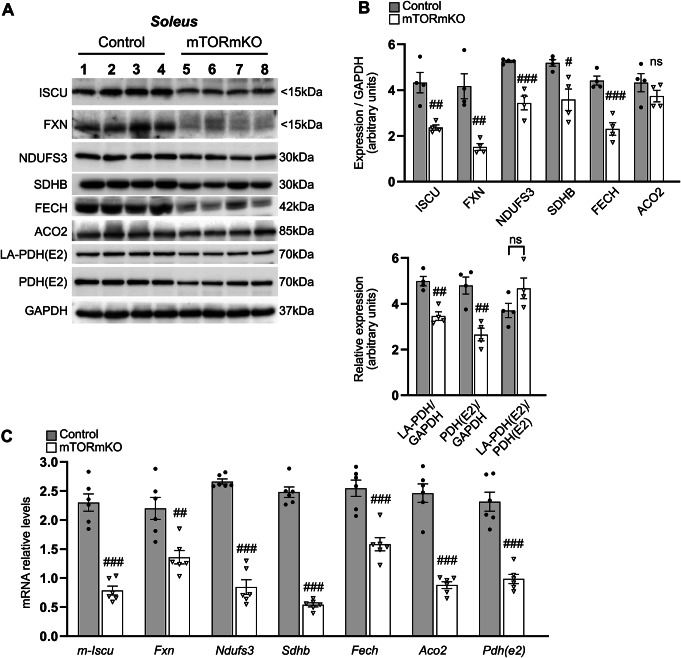
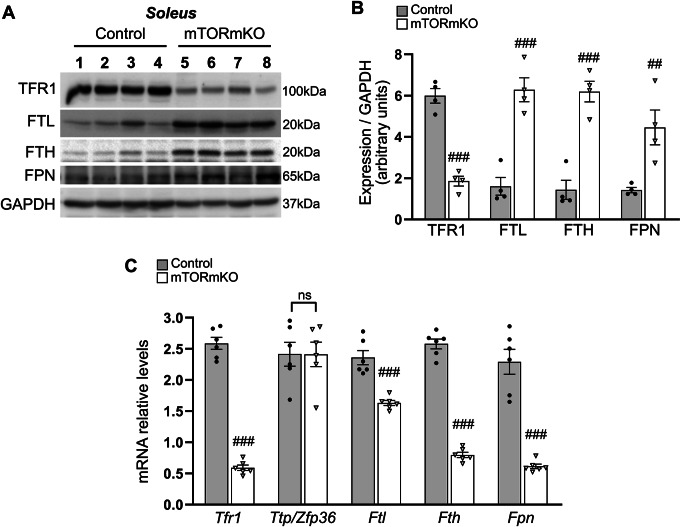
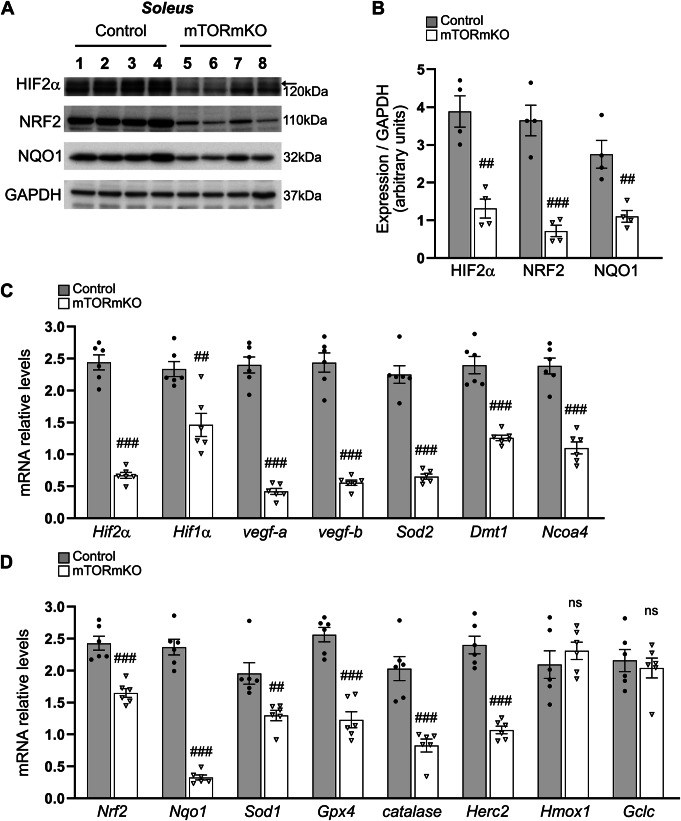
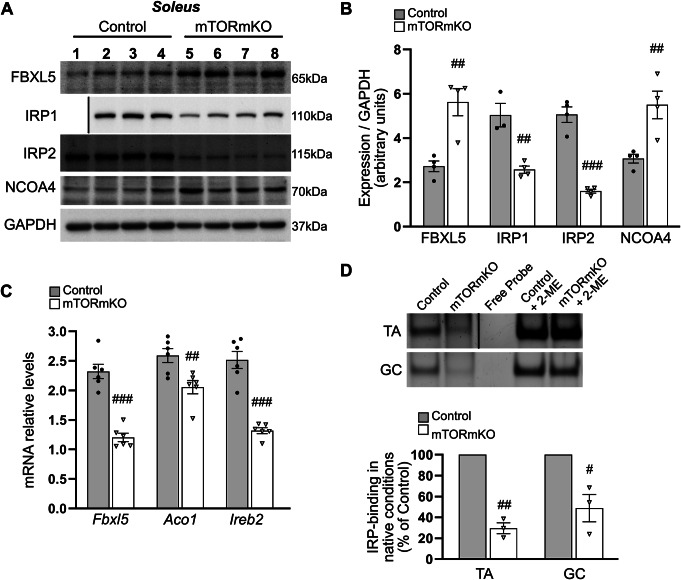
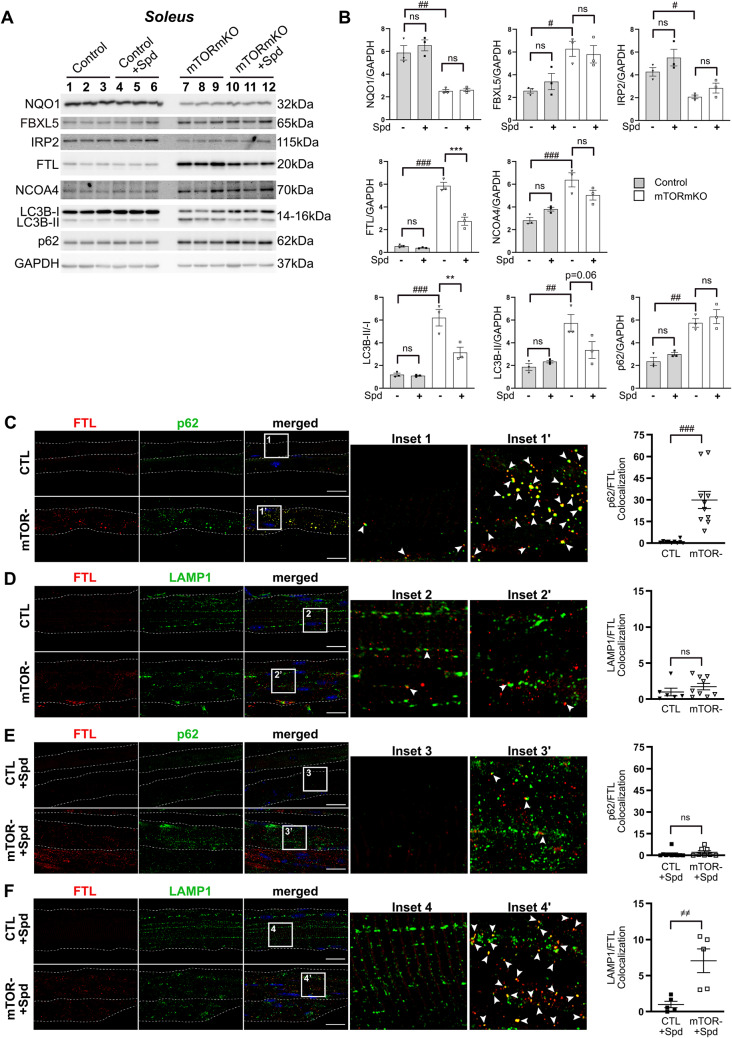
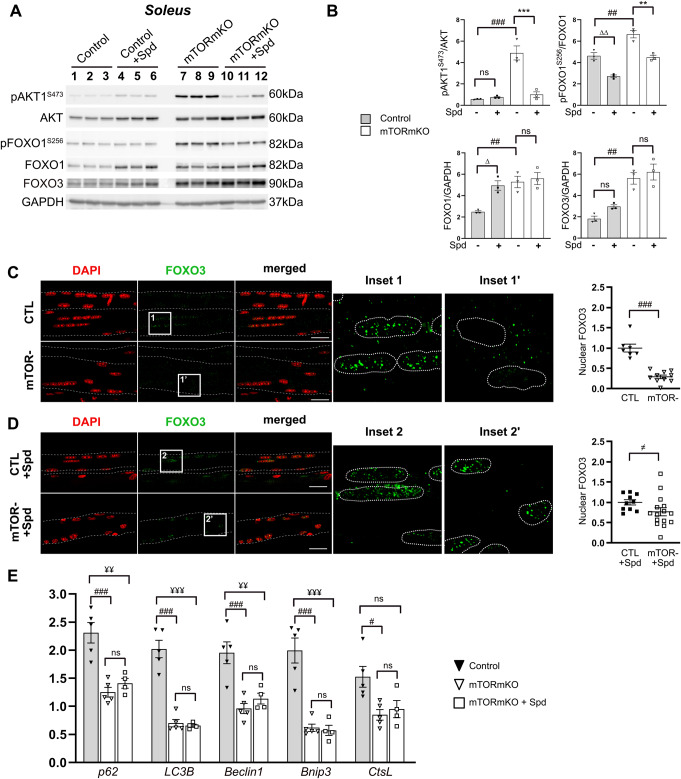
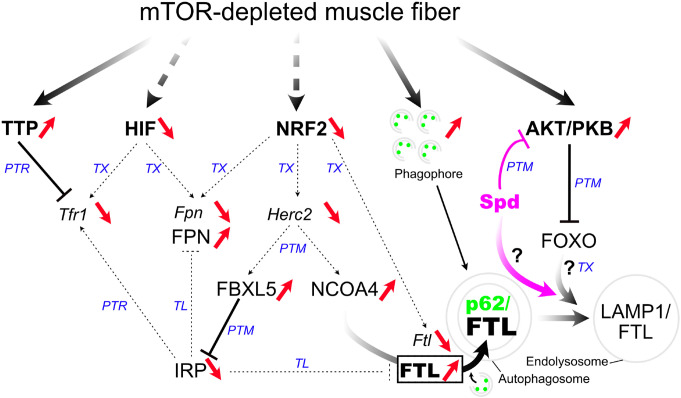
Balanced mTOR activity and iron levels are crucial for muscle integrity, with evidence suggesting mTOR regulates cellular iron homeostasis. In this study, we investigated iron metabolism in muscle-specific mTOR knockout mice (mTORmKO) and its relation to their myopathy. The mTORmKO mice exhibited distinct iron content patterns across muscle types and ages. Slow-twitch soleus muscles initially showed reduced iron levels in young mice, which increased with the dystrophy progression but remained within control ranges. In contrast, the less affected fast-twitch muscles maintained near-normal iron levels from a young age. Interestingly, both mTORmKO muscle types exhibited iron metabolism markers indicative of iron excess, including decreased transferrin receptor 1 (TFR1) and increased levels of ferritin (FTL) and ferroportin (FPN) proteins. Paradoxically, these changes were accompanied by downregulated Ftl and Fpn mRNA levels, indicating post-transcriptional regulation. This discordant regulation resulted from disruption of key iron metabolism pathways, including NRF2/NFE2L2, HIFs, and AKT/PKB signaling. Mechanistically, mTOR deficiency impaired transcriptional regulation of iron-related genes mediated by NRF2 and HIFs. Furthermore, it triggered ferritin accumulation through two NRF2 mechanisms: (1) derepression of ferritin translation via suppression of the FBXL5-IRP axis, and (2) autophagosomal sequestration driven by NCOA4-dependent ferritin targeting to autophagosomes, coupled with age-related impairments of autophagy linked to chronic AKT/PKB activation. Three-week spermidine supplementation in older mTORmKO mice was associated with normalized AKT/PKB-FOXO signaling, increased endolysosomal FTL and reduced total FTL levels in the dystrophic soleus muscle. These findings underscore mTOR's crucial role in skeletal muscle iron metabolism and suggest spermidine as a potential strategy to address impaired ferritinophagy due to autophagy blockade in dystrophic muscle.

Keywords: Autophagy; Dystrophy; Glycogen; Iron-sulfur cluster; Myoglobin; Oxidative stress.


Conflict of interest statement

Declarations. Ethics approval: Experimental protocols involving animals were performed in accordance with national and European legislation on animal experimentation and were approved by the local animal ethics committee (Apafis#18195; Ceccapp-ENS_2013_013; Ceccapp-ENS_2011_030). Consent to participate: Not applicable. Consent for publication: Not applicable. Conflict of interest: The authors declare no conflict of interest.

Figures

Fig. 1
Fig. 1
Impact of muscle mTOR deficiency on iron distribution and oxidative stress. (A) Western blot showing myoglobin (Mb) protein levels in soleus from 7- and 25-wk-old male mice and TA muscle from 25-wk-old male mice (N = 4). (B) Quantification of the western blot shown in (A) normalized to GAPDH protein level. (C) Concentrations of Fe(II) and Fe(III) in soleus muscles from 25-wk-old control and mTORmKO male mice (N = 6). (D) Left panels: Representative Perls’ staining of soleus (SOL), plantaris (PLA), and gastrocnemius (GC) muscles, along with spleen sections from 25-wk-old control and mTORmKO mice. Bar, 400 μm. Right panels: Higher magnification view of a region in the left panel. Bar, 100 μm. The staining reveals an absence of detectable iron deposits in mutant muscles, contrasting with the iron-rich red pulp of the spleen (black arrows) (N = 3). (E) Malondialdehyde (MDA) concentration in soleus and PLA muscles from 25-wk-old control and mTORmKO male mice (N = 5). (F) Protein carbonyl concentration in soleus and PLA muscles from 25-wk-old control and mTORmKO male mice (N = 6). N represents the number of individual mice used in each group. Values represent the mean ± SEM. #P ≤ 0.05; ##P ≤ 0.01; ###P ≤ 0.001; ns, not significant
Fig. 2
Fig. 2
Prolonged loss of mTOR in the soleus muscle does not compromise ISC biogenesis and integrity. (A) Immunoblots of soleus muscles from mTORmKO and control mice are shown for ISCU, FXN, NDUFS3, SDHB, FECH, ACO2, LA-PDH(E2), PDH(E2) and GAPDH (N = 4). (B) Upper and lower panels are densitometric quantifications of the western blots shown in (A) for the ISC-containing mitochondrial proteins compared to GAPDH, and PDH(E2) lipoylation, respectively. (C) Relative mRNA levels encoding the proteins shown in (A) in soleus muscles from control and mTORmKO mice (N = 6). N represents the number of individual male mice, aged 20–23 weeks, used in each group. Values represent the mean ± SEM. #P ≤ 0.05; ##P ≤ 0.01; ###P ≤ 0.001; ns, not significant
Fig. 3
Fig. 3
Sustained mTOR depletion in soleus muscle alters expression of iron biomarkers. (A) Western blot showing protein levels of TFR1, FTL, FTH, FPN and GAPDH in soleus muscles from control and mTORmKO mice (N = 4). (B) Densitometric measurements of TFR1, FTL, FTH, and FPN compared to GAPDH (in arbitrary units) in soleus muscles from both control and mTORmKO mice (N = 4). (C) qPCR analysis revealed the relative mRNA levels of Tfr1, Ttp/Zfp36, Ftl, Fth and Fpn in soleus muscles from control and mTORmKO mice (N = 6). N represents the number of individual male mice, aged 20–23 weeks, used in each group. Values represent the mean ± SEM. #P ≤ 0.05; ##P ≤ 0.01; ###P ≤ 0.001; ns, not significant
Fig. 4
Fig. 4
Long-term mTOR deficiency in soleus muscle alters HIFs and NRF2 signaling. (A) Immunoblotting showing protein levels of HIF2α, NRF2, NQO1 and GAPDH in soleus muscles from control and mTORmKO mice (N = 4). (B) Densitometric quantifications of HIF2α, NRF2, NQO1 relative to GAPDH (arbitrary units) in soleus muscles from control and mTORmKO mice (N = 4). (C) Relative mRNA levels of Hif2α and Hif1α and of several HIF-target genes including Vegf-a, Vegf-b, Sod2, Dmt1 and Ncoa4 in soleus muscles from control and mTORmKO mice (N = 6). (D) Relative mRNA levels of Nrf2 and of several NRF2-target genes including Nqo1, Sod1, Gpx4, catalase, Herc2, Hmox1 and Gclc in soleus muscles from control and mTORmKO mice (N = 6). N represents the number of individual male mice, aged 20–23 weeks, used in each group. Values represent the mean ± SEM. #P ≤ 0.05; ##P ≤ 0.01; ###P ≤ 0.001; ns, not significant
Fig. 5
Fig. 5
Prolonged loss of muscle mTOR leads to reduced inhibitory IRP activity on ferritin synthesis and NCOA4 upregulation. (A) Immunoblotting analysis of soleus muscles from control and mTORmKO mice showing the expression levels of FBXL5, IRP1, IRP2, NCOA4 and GAPDH (N = 3–4). (B) Densitometric quantifications of FBXL5, IRP1, IRP2 and NCOA4 relative to GAPDH (arbitrary units) in soleus muscles from control and mTORmKO mice (N = 3–4). (C) Relative mRNA levels of Fbxl5, Aco1 and Ireb2 in soleus muscles from control and mTORmKO mice (N = 6). (D) Upper panel: Analysis of IRE-binding activities to the IRE of ferritin-H in TA and gastrocnemius (GC) muscles from control and mTORmKO mice. The fluorescent probe (Alexa Fluor® 488) was incubated with muscle extracts in native or reducing conditions with 2-ME. Lower panel: quantification of IRP binding to the probe in mutant muscles compared to controls under native conditions. REMSA was performed three times for each condition (control and KO) using TA and GC muscles. In each experiment, two muscles (either TA or GC) from two different mice were used per condition (N = 6). N represents the number of individual male mice, aged 20–23 weeks, used in each group. Values represent the mean ± SEM. #P ≤ 0.05; ##P ≤ 0.01; ###P ≤ 0.001; ns, not significant
Fig. 6
Fig. 6
Impaired autophagy associated with chronic mTOR deficiency leads to autophagosomal FTL accumulation in soleus muscle. (A) Western blot analysis of NQO1, FBXL5, IRP2, FTL, NCOA4, LC3B lipidation, p62 and GAPDH in protein extracts from soleus muscles from control and mTORmKO female mice that were untreated or per os spermidine (Spd, 3 mM)-treated for 3 weeks (N = 3). (B) Densitometric quantifications of NQO1, FBXL5, IRP2, FTL, NCOA4, LC3B-II vs. LC3B-I, and of LC3B-II and p62 vs. GAPDH (arbitrary units) of untreated (–) and per os spermidine (Spd)-treated (+) control and mTORmKO female mice (N = 3). (C-F) Left panels: Isolated fibers of soleus muscles from control (CTL) and mTORmKO (mTOR-) female mice, untreated (C and D) or per os spermidine (Spd)-treated (E and F), were double-stained with FTL (in red) and either p62 (C and E; in green) or LAMP1 (D and F; in green) (N = 3; x = 19–47). Nuclei were labeled with DAPI (in blue in merged panels). White arrowheads points at colocalized puncta detected on the merged images as yellow dots. Dashed lines delimit muscle fibers. Scale bars: 25 µm; zoom sections (Inset 1–4 and 1’-4’). Right panels: colocalization quantification (in arbitrary units, n = 5–10). N represents the number of individual 25-wk-old female mice used in each group; x is the total number of dissociated fibers counted; n is total number of confocal images counted. Data presented as mean ± SEM. */#/∆/≠P ≤ 0.05; **/##/∆∆/≠≠P ≤ 0.01; ***/###/∆∆∆/≠≠≠P ≤ 0.001; ns, not significant. * is mTORmKO vs. treated mTORmKO, # is control vs. mTORmKO, is control vs. treated control, is treated control vs. treated mTORmKO
Fig. 7
Fig. 7
3-week spermidine treatment normalizes AKT/FOXO signaling without restoring autophagy-related gene expression in mTORmKO soleus muscle. (A) Western blot analysis of pAKT1S473, AKT, pFOXO1S256, FOXO1, FOXO3, and GAPDH in protein extracts from soleus muscles of 25-wk-old control and mTORmKO female mice that were untreated or per os spermidine (Spd, 3 mM)-treated for 3 weeks (N = 3). (B) Densitometric quantifications of pAKT1S473 vs. AKT, pFOXO1S256 vs. FOXO1 and of FOXO1, FOXO3 vs. GAPDH (arbitrary units) of untreated (–) and per os spermidine (Spd)-treated (+) control and mTORmKO female mice (N = 3). (C-D) Left panels: Isolated fibers of soleus muscles from control (CTL) and mTORmKO (mTOR-) female mice, untreated (C) or per os spermidine (Spd)-treated (D), were stained with FOXO3 (in green) (N = 3; x = 139–515). Nuclei were labeled with DAPI (in red). Thin dashed lines delimit muscle fibers, and thick dashed lines delimit nuclei. Scale bars: 25 µm; zoom sections (Inset 1–2 and 1’-2’). Right panels: quantification of nuclear FOXO3 (in arbitrary units, n = 10–15). (E) qPCR analysis revealed the relative mRNA levels of p62, LC3B, Beclin1, Bnip3 and CtsL in soleus muscles from control, untreated mTORmKO and Spd-treated mTORmKO mice (N = 4–5). N represents the number of individual 25-wk-old female mice used in each group; x is the total number of nuclei counted; n is total number of confocal images counted. Data presented as mean ± SEM. */#/∆/≠/¥P ≤ 0.05; **/##/∆∆/≠≠/¥¥P ≤ 0.01; ***/###/∆∆∆/≠≠≠/¥¥¥P ≤ 0.001; ns, not significant. * is mTORmKO vs. treated mTORmKO, # is control vs. mTORmKO, is control vs. treated control, is treated control vs. treated mTORmKO, ¥ is Control vs. treated mTORmKO
Fig. 8
Fig. 8
Schematic model: Impact of mTOR depletion on iron homeostasis signaling in skeletal muscle. - mTOR depletion disrupts NRF2 and HIF signaling, leading to the mRNA downregulation of key iron-related genes, including Tfr1, Ftl, Fpn and Herc2; HIF-mediated Ncoa4 mRNA regulation is omitted for clarity. - Tfr1 mRNA expression may be further suppressed through dual mechanisms: induction of TTP/ZFP36, an mRNA-destabilizing protein, and downregulation of the IRP system, which typically stabilizes Tfr1 transcripts under low-iron conditions. - Reduced NRF2 activity lowers HERC2 levels, an E3 ubiquitin ligase for both FBXL5 (another E3 ubiquitin ligase) and NCOA4 (a cargo receptor for FTL). - Elevated FBXL5 suppresses IRP expression and activity, enhancing FTL and FPN protein translation. - Increased NCOA4, combined with autophagy induction caused by mTOR depletion, promotes FTL recruitment to autophagosomes for ferritinophagy. - Chronic feedback AKT/PKB activation due to mTOR depletion triggers FOXO-mediated autophagy blockade associated with autophagosomal FTL accumulation. - Spermidine (Spd) treatment normalizes AKT-FOXO signaling, increases endolysosomal FTL and reduces total FTL levels. The molecular details underlying Spd’s effect on endolysosomal FTL remains to be elucidated. TX, transcriptional regulation; PTR, post-transcriptional regulation; TL, translational regulation; PTM, post-translational modification

Similar articles

References

    1. Braymer JJ, Lill R (2017) Iron-sulfur cluster biogenesis and trafficking in mitochondria. J Biol Chem 292:12754–12763. 10.1074/jbc.R117.787101 - PMC - PubMed
    1. Jahng JWS, Alsaadi RM, Palanivel R, Song E, Hipolito VEB, Sung HK et al (2019) Iron overload inhibits late stage autophagic flux leading to insulin resistance. EMBO Rep 20:e47911. 10.15252/embr.201947911 - PMC - PubMed
    1. Alves FM, Kysenius K, Caldow MK, Hardee JP, Crouch PJ, Ayton S et al (2021) Iron accumulation in skeletal muscles of old mice is associated with impaired regeneration after ischaemia-reperfusion damage. J Cachexia Sarcopenia Muscle 12:476–492. 10.1002/jcsm.12685 - PMC - PubMed
    1. Xu J, Hwang JC, Lees HA, Wohlgemuth SE, Knutson MD, Judge AR et al (2012) Long-term perturbation of muscle iron homeostasis following hindlimb suspension in old rats is associated with high levels of oxidative stress and impaired recovery from atrophy. Exp Gerontol 47:100–108. 10.1016/j.exger.2011.10.011 - PMC - PubMed
    1. Halon-Golabek M, Borkowska A, Kaczor JJ, Ziolkowski W, Flis DJ, Knap N et al (2018) hmSOD1 gene mutation-induced disturbance in iron metabolism is mediated by impairment of Akt signalling pathway. J Cachexia Sarcopenia Muscle 9:557–569. 10.1002/jcsm.12283 - PMC - PubMed

MeSH terms

LinkOut - more resources