. 2025 Jun 6;24(6):3049-3061.
doi: 10.1021/acs.jproteome.5c00194. Epub 2025 Apr 28.

SPE-CZE-MS Quantifies Zeptomole Amounts of Phosphorylated Peptides

Affiliations

SPE-CZE-MS Quantifies Zeptomole Amounts of Phosphorylated Peptides

Lia R Serrano et al. J Proteome Res. .

Abstract

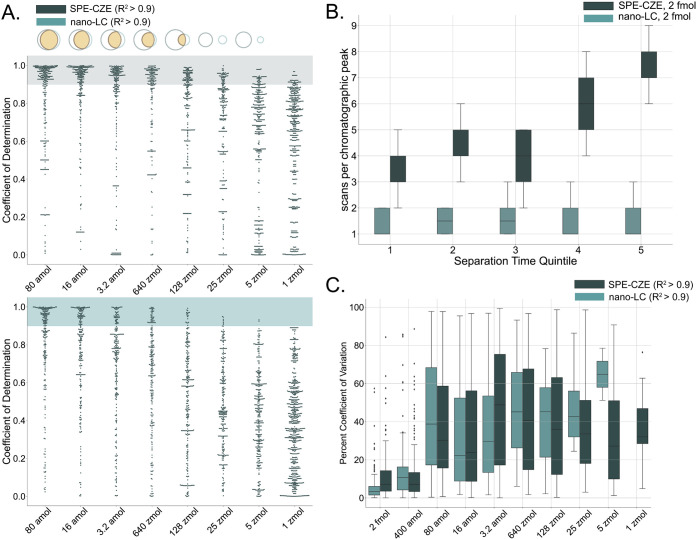
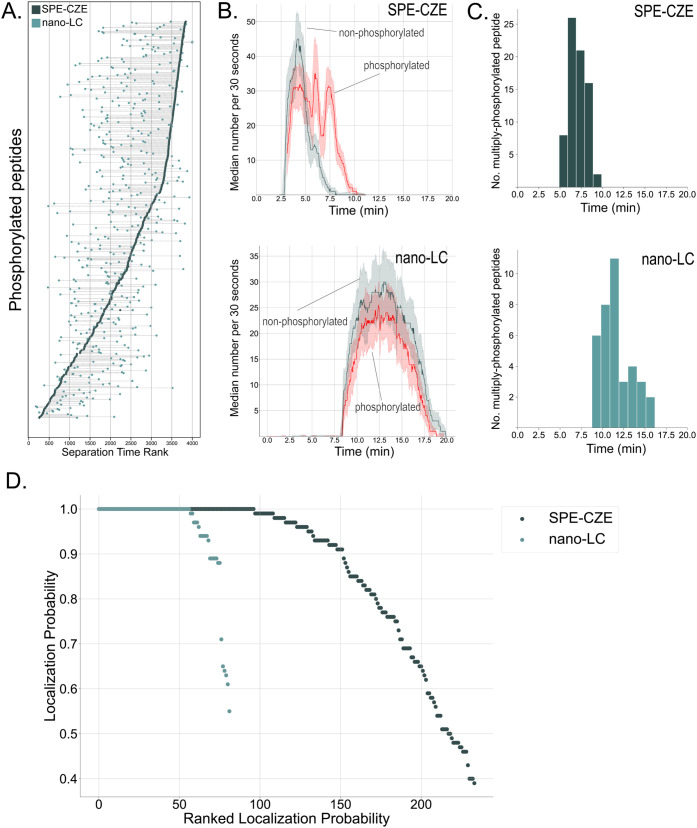
Capillary zone electrophoresis (CZE) is gaining attention in the field of single-cell proteomics for its ultralow-flow and high-resolution separation abilities. Even more sample-limited yet rich in biological information are phosphoproteomics experiments, as the phosphoproteome composes only a fraction of the whole cellular proteome. Rapid analysis, high sensitivity, and maximization of sample utilization are paramount for single-cell analysis. Some challenges of coupling CZE analysis with mass spectrometry analysis (MS) of complex mixtures include 1. sensitivity due to volume loading limitations of CZE and 2. incompatibility of MS duty cycles with electropherographic time scales. Here, we address these two challenges as applied to single-cell-equivalent phosphoproteomics experiments by interfacing a microchip-based CZE device integrated with a solid-phase-extraction (SPE) bed with the Orbitrap Astral mass spectrometer. Using 225 phosphorylated peptide standards and phosphorylated peptide-enriched mouse brain tissue, we investigate microchip-based SPE-CZE functionality, quantitative performance, and complementarity to nano-LC-MS (nLC-MS) analysis. We highlight unique SPE-CZE separation mechanisms that can empower fit-for-purpose applications in single-cell-equivalent phosphoproteomics.

Keywords: Astral; SPE; capillary zone electrophoresis; phosphoproteomics; preconcentration.


Figures

1
1
SPE-CZE-MS workflow for low-load phosphoproteomics. (A) 5-fold serially diluted synthetic phosphorylated peptide standards or phosphorylated peptide-enriched mouse brain tissue were loaded onto the SPE-CZE device and electrokinetically separated over 15 min using a 500 V/cm electric potential before Orbitrap Astral DIA analysis. (B) Electropherogram of 32 ng on-chip analysis of enriched mouse brain tissue showing an 8 min separation window.
2
2
Volume overload characterization. (A) Electropherographic peaks for peptide GT­(phos)­PPLTPSDSPQTR + + for loading times 0.5, 1, 2, 4, 8 min that apexes at 4 min. (B) GT­(phos)­PPLTPSDSPQTR + + integrated peak area as a function of load time. (C) Percent CV distributions of standards for each load time. (D) Manually inspected precursor ions (n = 558) were binned into nLC retention time bins as a proxy for hydrophobicity measures. Each set were normalized to the highest intensity value per response curve. The median of each bin plotted as a function of load time. (E) The same precursor peak areas are plotted as a function of loading amount with loading time held constant.
3
3
Separation characterization for synthetic standards and complex mixtures. Full width-half-maximum values for 2 fmol standards (A) and 32 ng load enriched mouse brain tissue (B) analyzed with SPE-CZE-MS binned by migration time quintile. Concentration factor distributions of 2 fmol standards.
4
4
Quantitative performance assessment with synthetic phosphorylated peptide standards. (A) Phosphorylated peptide standard response curves were generated for 3-point curves (down to 80 amol), 4-point (16 amol), 5-point (3.2 amol), 6-point (640 zmol), 7-point (128 zmol), 8-point (25 amol), 9-point (5 zmol), and 10-point (1 zmol) for samples analyzed with either SPE-CZE-MS or nLC-MS. Coefficients of determination are plotted for each curve for SPE-CZE-MS (top) and nLC-MS (bottom). (B) Distributions of MS2 scans per electropherographic peak (fwhm) as a function of separation time quintile for each separation method for the 2 fmol loading amount. (C) Distributions of percents coefficient of variation for replicates of standards that had response curves with r-squared values >0.9.
5
5
Characterization and quantitative performance assessment for enriched phosphorylated peptides. (A) Average phosphorylated peptides, sites and proteins for each loading amount of phosphorylated peptide-enriched mouse brain tissue analyzed on SPE-CZE-MS or nLC-MS. Phosphorylation site intensities relative to the summed intensities for the 32-ng loaded sample on SPE-CZE-MS (B) and nLC-MS (C) are plotted against that for the 6 ng and 1 ng samples. Regression analysis determined r-squared values of 0.95 and 0.9 for 6 ng and 1 ng samples analyzed on SPE-CZE-MS respectively, and 0.91 and 0.79 for the 6 ng and 1 ng analyzed on nLC-MS, respectively. The standard errors for these best fit lines on SPE-CZE-MS are 0.006 and 0.018 while that for nLC-MS are 0.009 and 0.031. (D) Overlap of phosphorylation sites across loading amounts from 32 ng to 50 pg.
6
6
Complementary selectivity between SPE-CZE-MS and nLC-MS confers benefits for multiply phosphorylated peptide analysis. (A) Ranked separation time from SPE-CZE-MS and nLC-MS analysis are plotted for each shared phosphorylated peptide from the 1 ng load. (B) The median and standard deviation of number of phosphorylated (red) or nonphosphorylated peptide (dark blue) identification (binned in increments of 30 s) over separation time for SPE-CZE-MS (top) and nLC-MS (bottom). (C) Number of multiply phosphorylated peptides over migration time window for SPE-CZE-MS (top) and nLC-MS (bottom). (D) Localization probability as a function of ranked localization probability for multiply phosphorylated peptides analyzed with SPE-CZE-MS or nLC-MS.

Update of

References

    1. Wilm M., Mann M.. Analytical properties of the nanoelectrospray ion source. Anal. Chem. 1996;68:1–8. doi: 10.1021/ac9509519. - DOI - PubMed
    1. Valaskovic G. A., Kelleher N. L., Little D. P., Aaserud D. J., McLafferty F. W.. Attomole-sensitivity electrospray source for large-molecule mass spectrometry. Anal. Chem. 1995;67:3802–3805. doi: 10.1021/ac00116a030. - DOI - PubMed
    1. Cheng Y. F., Wu S., Chen D. Y., Dovichi N. J.. Interaction of capillary zone electrophoresis with a sheath flow cuvette detector. Anal. Chem. 1990;62:496–503. doi: 10.1021/ac00204a014. - DOI
    1. Horiuchi K., Dutta P.. Joule heating effects in electroosmotically driven microchannel flows. Int. J. Heat Mass Transfer. 2004;47:3085–3095. doi: 10.1016/j.ijheatmasstransfer.2004.02.020. - DOI
    1. Burgreen D., Nakache F. R.. Electrokinetic Flow in Ultrafine Capillary Slits 1. J. Phys. Chem. 1964;68(5):1084–1091. doi: 10.1021/j100787a019. - DOI

Substances

LinkOut - more resources