. 2025 Apr 28;20(4):e0321463.
doi: 10.1371/journal.pone.0321463. eCollection 2025.

Multi-parametric quantitative MRI of the lower limb muscles in a longitudinal study of limb-girdle muscular dystrophy R9

Affiliations

Multi-parametric quantitative MRI of the lower limb muscles in a longitudinal study of limb-girdle muscular dystrophy R9

Susanne S Rauh et al. PLoS One. .

Abstract

Background and objectives: Limb-girdle muscular dystrophy R9 (LGMD-R9) is a rare neuromuscular disease with no curative treatment. Sensitive non-invasive biomarkers are necessary to monitor disease progression and evaluate the efficacy of novel therapies. Here, we investigated several quantitative MRI parameters as suitable biomarkers for evaluating disease progression in LGMD-R9.

Methods: Bilateral quantitative MRI of the lower limbs was performed in individuals with LGMD-R9 and healthy controls. Quantitative thigh and leg muscle MRI, functional tests (including time-up-and-go (TUG) and time-to-climb-4-stairs (4S climb)), and muscle strength tests were performed in individuals with LGMD-R9 at baseline, 1-year, and 2-years. qMRI included assessment of muscle fat fraction (FF), water T2, water T1, intramuscular pH from 1H MR spectroscopy, and diffusion tensor imaging (DTI) parameters. Differences between LGMD-R9 and controls, over time, and the relationship between baseline water T1 and water T2 parameters and disease progression (FF, functional and strength parameters) were assessed by linear mixed models and correlation analyses.

Results: 18 individuals with LGMD-R9 and 13 controls were enrolled. At baseline, elevated FF, water T2, water T1, and pH were observed in LGMD-R9 (p < 0.05). No differences between controls and LGMD-R9 were found in the DTI parameters. An overall tendency to an increase in FF and a decrease in functional measures were observed over 2 years. However, the changes did not reach significance (p = 0.057-0.752). Baseline water T1 and baseline water T2 correlated with the increase in FF (ΔFF) and change in TUG (ΔTUG) and 4S climb (Δ4S climb) over 2 years (correlation coefficient ≥ 0.6, p < 0.05). No correlation with the strength measures was found.

Conclusion: Our findings suggest that FF, water T2, water T1, and pH are effective biomarkers for LGMD-R9. The correlation of water T2 and water T1 with ΔFF, ΔTUG, and Δ4S climb suggests their potential in predicting disease progression.


Conflict of interest statement

S. Olivier is a full-time employee of Atamyo Therapeutics. R. Zanfongnon is a full-time employee of Généthon. The Institute of Myology received payments from Généthon for the work as a central reader in the overall GNT-015-FKRP natural history study. Généthon provided support in the form of salaries for authors regarding the central reading of the data. Généthon and Atamyo Therapeutics did not have any additional role in the study design, data collection and analysis, decision to publish, or preparation of the manuscript. The specific roles of these authors are articulated in the “author contributions” section.

Figures

Fig 1
Fig 1. Flow chart of participant inclusion.
Flow chart of the participant inclusion and the number of included muscles for all MRI measures and the number of participants for the functional and strength tests. The total number of segmented muscles per visit and MRI measure is given in gray. BL, baseline; cCSA, contractile cross-sectional area; FF, fat fraction; FVC, forced vital capacity; DTI, diffusion tensor imaging; NSAD, North Star Assessment for Limb-Girdle Type Muscular Dystrophies; 6MWT, 6 minute walk test; 10mWT, 10 m walk test; 4SC, 4 stair climb and descend test.
Fig 2
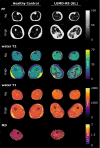
Fig 2. qMRI parameter maps.
Parameter maps from the legs and thighs of a healthy control (54y) and a representative individual with LGMD-R9 (62y, 8.6 years since diagnosis). In the patient elevated FF, water T2, and water T1 are visible in both, legs and thighs. FF, fat fraction; BL, baseline; MD, mean diffusivity.
Fig 3
Fig 3. Bar plots of qMRI parameters.
Bar plots comparing the LGMD-R9 at baseline (blue) and the controls (orange), showing the mean ± standard deviation, for FF, water T2, water T1, cCSA, MD at diffusion time 116.3 ms, and pH, for all muscles. The individual data points are overlaid as dots. Muscles from the thighs and legs are separated by the dotted line. cCSA, contractile cross-sectional area; FF, fat fraction; MD, mean diffusivity. Muscles in the order of appearance: VL, vastus lateralis; VM, vastus medialis, VI, vastus intermedius; RF, rectus femoris; BF, biceps femoris long head; SM, semimembranosus; ST, semitendinosus; AM, adductor magnus; AL, adductor longus; GRA, gracilis; SAR, sartorius; ED, extensor digitorium; TA, tibialis anterior; TP, tibialis posterior; PER, peroneus longus; SOL, soleus; GM, gastrocnemius medialis; GL, gastrocnemius lateralis; QUAD, quadriceps; HSTR, hamstrings; ANT, anterior compartment; FIB, fibularis; TRIC, triceps surae. *p<0.0056 (= 0.05/9). †p<0.05.
Fig 4
Fig 4. Bar plots of DTI parameters.
Bar plots comparing the DTI parameters between LGMD-R9 at baseline (blue) and controls (orange) in the global leg at all diffusion times. DTI, diffusion tensor imaging; FA, fractional anisotropy; λ1- λ3, diffusion tensor eigenvalues; MD, mean diffusivity.
Fig 5
Fig 5. Time course of qMRI, functional, and strength measurs.
Line plots showing the time course over the years since diagnosis. Each line represents an individual with LGMD-R9 and the same colors show the same participant. A. FF in the global thigh and global leg. B. FF in the most and least fat-replaced thigh and leg muscles (AM, VM, GM, TA). C. Functional measures NSAD and FVC. D. Strength tests for knee extension and ankle plantarflexion. The predicted strength is shown. AM, adductor magnus; VM, vastus medialis; GM, gastrocnemius medialis; TA, tibialis anterior; FF, fat fraction; FVC, forced vital capacity; NSAD, North Star Assessment for Limb-Girdle Type Muscular Dystrophies.
Fig 6
Fig 6. Predictive value of disease activity-sensitive qMRI parameters.
Regression plots of ΔFF with A. Baseline water T2 and B. Baseline water T1 values. The dots represent individuals with LGMD-R9 and the red line indicates the mean value in the controls. AL, adductor longus; GM, gastrocnemius medialis; TP, tibialis posterior; VM, vastus medialis. *p < 0.05, **p < 0.01.

References

    1. Murphy LB, Schreiber-Katz O, Rafferty K, Robertson A, Topf A, Willis TA, et al.. Global FKRP registry: observations in more than 300 patients with limb girdle muscular dystrophy R9. Ann Clin Transl Neurol. 2020;7(5):757–66. doi: 10.1002/acn3.51042 - DOI - PMC - PubMed
    1. Straub V, Murphy A, Udd B, LGMD workshop study group. 229th ENMC international workshop: limb girdle muscular dystrophies - nomenclature and reformed classification Naarden, the Netherlands, 17-19 March 2017. Neuromuscul Disord. 2018;28(8):702–10. doi: 10.1016/j.nmd.2018.05.007 - DOI - PubMed
    1. Endo T. Glycobiology of α-dystroglycan and muscular dystrophy. J Biochem. 2015;157(1):1–12. doi: 10.1093/jb/mvu066 - DOI - PubMed
    1. Kanagawa M. Dystroglycanopathy: from elucidation of molecular and pathological mechanisms to development of treatment methods. Int J Mol Sci. 2021;22(23):13162. doi: 10.3390/ijms222313162 - DOI - PMC - PubMed
    1. Ortiz-Cordero C, Bincoletto C, Dhoke NR, Selvaraj S, Magli A, Zhou H, et al.. Defective autophagy and increased apoptosis contribute toward the pathogenesis of FKRP-associated muscular dystrophies. Stem Cell Reports. 2021;16(11):2752–67. doi: 10.1016/j.stemcr.2021.09.009 - DOI - PMC - PubMed

MeSH terms