. 2025 Aug 4;15(8):1676-1696.
doi: 10.1158/2159-8290.CD-24-1409.

PLT012, a Humanized CD36-Blocking Antibody, Is Effective for Unleashing Antitumor Immunity Against Liver Cancer and Liver Metastasis

Affiliations

PLT012, a Humanized CD36-Blocking Antibody, Is Effective for Unleashing Antitumor Immunity Against Liver Cancer and Liver Metastasis

Sheue-Fen Tzeng et al. Cancer Discov. .

Abstract

Tumor cells develop various strategies to evade immune surveillance, one of which involves altering the metabolic state of the tumor microenvironment. In response to metabolic stress in the tumor microenvironment, several tumor-infiltrating immune subsets upregulate CD36 to take up lipids. This leads to impaired antitumor immunity, as intratumoral regulatory T cells exhibit increased survival and suppressive activity, whereas CD8+ T cells become more susceptible to ferroptosis and exhaustion. In this study, we develop a humanized anti-CD36 IgG4 antibody, PLT012, against the lipid-binding domain of CD36 with excellent safety and favorable pharmacokinetic features in mice and cynomolgus monkeys. PLT012 alone or in combination with PD-L1 blockade or standard-of-care immunotherapy results in robust antitumor immunity in both immunotherapy-sensitive and -resistant hepatocellular carcinomas (HCC). Notably, PLT012 also reprograms the immune landscape of human HCC ex vivo. Our findings provide proof-of-concept evidence that PLT012 reprograms antitumor immunity in HCC, positioning it as a first-in-class immunotherapy targeting CD36.

Significance: Despite the success of cancer immunotherapies, like immune checkpoint inhibitors, many patients still fail to demonstrate significant responses because of metabolic constraints in tumors. PLT012 rejuvenates antitumor immunity by targeting metabolic pathways to reprogram the immune landscape of liver cancer and liver metastasis, with potential to influence future HCC immunotherapy.


Figures

Figure 1
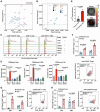
Figure 1. Assessment of the binding epitopes of PLT012 on CD36 and the inhibition of fatty acid uptake for PLT012.
A, CD36-expressing F293 cells were incubated with PLT012 at concentrations ranging from 0.002 to 10 μg/mL, followed by FACS analysis using commercial anti-CD36 antibodies, D2712. B, Human CD36-expressing F293 cells were pre-incubated with PLT012 at concentrations ranging from 0.01 to 30 μg/mL, followed by oxLDL-Dil staining for oxLDL binding with an IC50 at 0.25 (Left) and uptake with an IC50 at 0.19 (Right). C, oxLDL-Dil uptake in the indicated cell populations from MC38 tumor was analyzed using flow cytometry. D, The structural analysis for in vitro-reconstituted protein complex comprising the Fab region of PLT012 and the extracellular domain (ECD) of CD36 using Cryo-electron microscopy (CryoEM). Two interaction domains on the CD36 ECD for PLT012 binding were identified, corresponding to amino acid residues 153 to 160 and 191 to 197, highlighted in red. E, Binding activity was assessed in F293 cells transiently expressing FLAG-tagged CD36 with specific point mutations in Domain 1 (mD1) and/or Domain 2 (mD2) in the presence of varying concentrations of PLT012 through flow cytometry. Data are representative outcomes from three independent experiments and are expressed as mean ± s.d. Statistical analysis was conducted using two-tailed, unpaired Student’s t-test.
Figure 2
Figure 2. PLT012 displays enhanced distribution and targeting capabilities for hepatocellular carcinomas.
A and B, An in silico pan-cancer analysis of TCGA cohort revealed characteristics associated with fatty acid scores (A), as well as a correlation between tumoral populations of regulatory T cells (Tregs) and CD8+ T cells (B). C and D, Representative histogram plots (C) and quantitative results (D) for CD36 levels of indicated TILs derived from liver, blood, and spleen of normal (N) and HCC tumor-bearing (T) mice, stained by AF647-conjugated PLT012. E, In vivo distribution analysis of PLT012 in the liver from mice with or without MYCOE/CTNNB1N90 liver tumors were examined in IVIS 24 hours following intraperitoneal injection of one dose of AF647-conjugated PLT012 (10mg/kg, n=3/ group). Right, Representative liver fluorescence images from indicated groups. F-H, Quantitative results and Representative plots for in vivo binding of PLT012 in Tregs (F), CD8+ T cells (G), and NKs (H) of the liver tissues from normal and HCC tumors-bearing mice 24 and 48 hours after intraperitoneal administration of one dose of AF647-conjugated PLT012 (10mg/kg, n=4/ group). Data are representative results of two independent experiments (C-H). Data are means ± s.e.m. and analyzed by two-tailed, unpaired Student’s t-test (C-H).
Figure 3
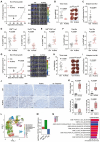
Figure 3. PLT012 treatment promotes anti-tumor immunity in preclinical HCC mouse models.
A, MYCOE/p53KO HCC tumors received PLT012 treatment at a dosage of 10 mg/kg, given once every three days, with tumor progression monitored via bioluminescence imaging in IVIS System. Right, representative images for tumor growth in indicated groups. B and C, Tumor weight (B) and ex vivo BLI (C) of MYCOE/p53KO HCC tumors at the endpoint, as indicated in 3A. D, Proportion for CD8+ T cells (Left) and Tregs (Right) form indicated groups in MYCOE and p53KO HCC mouse model. E, CD8 T cell activity of indicated tumor samples assessed through determining the percentage of granzyme B (GrB)-positive T cell among CD45+ cells using FACS. F, Population for Prog Tex and Term Tex among CD45+ cells from tumors with indicated treatment. G, Tumor was generated by MYCOE and CTNNB1N90 plasmids and examined through BLI following treatment with either a control or PLT012 (10 mg/kg, administered once every three days for a total of 5 doses). Right, representative images for tumor growth in indicated groups. H and I, Tumor weight (H) and ex vivo BLI (I) of the liver tumors at the endpoint from 3G. J and K, Representative histology images (J) and quantitative results (K) for staining of CD8, granzyme B, FoxP3, and cleavage caspase 3 (cl. Caspase3) in indicated groups. Slides were counterstained with hematoxylin. Scale bars: 50 μm. L, Uniform Manifold Approximation and Projection (UMAP) visualization of T cells filtered in silico from whole liver CD45+ cells combining both PLT012 and Ctrl samples. Each T cell population detected was annotated using ProjecTILs alongside manual classification (See Fig. S3L). M, Ratio of PLT012 to Ctrl relative frequencies for annotated CD8+ Tex, CD8+ Tpex, and Tregs subsets, respectively (See Fig. S3M and Supplementary Table S1). N, Gene Set Enrichment Analysis (GSEA) normalized enrichment scores for T cell activation pathways, with significant enrichment (adjusted p-value < 0.05) based on differential gene expression in CD8+ Tex cells from PLT012 vs. Ctrl conditions (see Supplementary Table S2). Bar filling indicates the adjusted P-value associated with the enrichment analysis. Each symbol represents one individual. Data are cumulative results of three independent experiments, represented as means ± s.e.m. (A-K) and as a Box plot with Tukey whiskers indicating minimum to maximum range in panel K. The P-value is determined by two-tailed, unpaired Student’s t-test.
Figure 4
Figure 4. PLT012 administration improves therapeutic efficacy of immune checkpoint inhibitors in the treatment of HCC.
A, Tumor growth under the indicated treatment regimen, assessed via BLI in IVIS, n=14-15/group. B and C, Ex vivo BLI (B) and corresponding tumor weights (C) of MYCOE/CTNNB1N90 HCC tumors across the designated groups. D-H, FACS analysis for Tregs (D), CD8+ T cells (E), granzyme B (GrB+)-expressing CD8+ T cells (F), progenitor-exhausted T cells (Prog Tex; G), and terminal-exhausted T cells (Term Tex; H) in indicated groups. I-K, Tumor growth (I), ex vivo liver BLI (J), and tumor mass (K) of MYCOE/CTNNB1N90 HCC tumor model following indicated treatments, n=11/ group. L, Response rate from 4I, presented as Complete Response (CR), Partial Response (PR), Progressive Disease (PD), and Stable Disease (SD). Data are the cumulative results from at least two independent experiments, with each symbol representing one individual. Data are means ± s.e.m. and analyzed by One-way ANOVA.
Figure 5
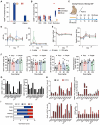
Figure 5. Impacts of PLT012 on HCC in a lipid-dense milieu.
A, Experiment design and procedure, n=12-13/group. B-D, Tumor growth (B), tumor mass (C), and ex vivo tumor BLI (D) of MYCOE/CTNNB1N90 HCC tumors were assessed in indicated groups. E-I, Proportions of Tregs (E), CD8+ T cells (F), granzyme B+ CD8 T cells (G), Prog Tex (H), and Term Tex (I) within the CD45+ cell population were quantified using FACS. Data are the cumulative results from three independent experiments, with each symbol representing one individual. Data are means ± s.e.m. and analyzed by One-way ANOVA. (Created with BioRender.com)
Figure 6
Figure 6. PLT012 treatment suppresses primary and metastasis in a mouse model of colon cancer.
A and B, An in silico analysis of POG570 cohort for expression level of CD36 and fatty acid metabolism score, as well as relative percentages for Treg and CD8 T cells across various metastatic sites (A) and aggressive tumor types (B). C, Schematic representation of PLT012 treatment protocol utilized in the MC38 colon cancer metastasis model. D and E, Growth curve of MC38 liver metastases (D) and subcutaneous tumors (E) in mice treated with vehicle control (Ctrl), anti-PD-1, PLT012, or combination (combo). F and G, Analysis of the percentages of CD8 T cells and Tregs percentages within CD45+ cells in liver metastasis (F) and primary tumors (G). H and I, Representative plots (H) and quantitative results (I) for population of M1 and M2 macrophages among CD45+ cells from the indicated groups. Data are the cumulative results from two independent experiments. Each symbol represents one individual. Data are means ± s.e.m. and analyzed by One-way ANOVA.
Figure 7
Figure 7. The safety and efficacy study of PLT012 was evaluated involving repeated doses in non-human primates and human HCC patients’ ex vivo tissue fragments.
A and B, FACS analysis of CD36 expression levels in red blood cells (RBCs) and platelets (A), as well as in CD4, CD8, B cells, and monocytes from PBMC samples of humans, cynomolgus monkeys, and mice (B). C, Diagram depicting the procedure for the dose range finding (DRF) study of PLT012, involving 5 repeated doses at concentrations of 0, 10, 60, and 200 mg/kg. D and E, Serum concentrations of ALT and AST (D) and number of circulating RBC and platelets (E) were measured over the study period at the indicated doses. F, Proportions of CD4, CD8, NK cells, and monocytes within CD45+ cells were assessed on Day 1 and Day 29 in cynomolgus monkeys receiving PLT012 treatment. G, Proportion of CD36 positive CD8 T cells and Tregs identified in human HCC tissue fragments through FACS, following the indicated treatment (n=11). H, FACS analysis was conducted to evaluate the pharmacodynamic immune profiles of indicated TILs in ex vivo human HCC tissue fragments after a two-day culture period with either control or PLT012 antibodies (n=11). I, Response rates based on pharmacodynamic markers into three classifications: SR (Strong Response, defined as a fold change greater than 2), MR (Moderate Response, defined as a fold change between 1 and 2), and NR (No Response). Data are presented as mean ± sd in panels A-F, with a sample size of n = 4 animals, comprising both male and female subjects, for each treatment group. (Created with BioRender.com)

References

    1. Chuang YM, Tzeng SF, Ho PC, Tsai CH. Immunosurveillance encounters cancer metabolism. EMBO Rep. 2024;25(2):471–88. doi: 10.1038/s44319-023-00038-w. - DOI - PMC - PubMed
    1. Zhang S, Lv K, Liu Z, Zhao R, Li F. Fatty acid metabolism of immune cells: a new target of tumour immunotherapy. Cell Death Discov. 2024;10(1):39. doi: 10.1038/s41420-024-01807-9. - DOI - PMC - PubMed
    1. Hanahan D. Hallmarks of Cancer: New Dimensions. Cancer Discov. 2022;12(1):31–46. - PubMed
    1. Li X, Wenes M, Romero P, Huang SC, Fendt SM, Ho PC. Navigating metabolic pathways to enhance antitumour immunity and immunotherapy. Nat Rev Clin Oncol. 2019;16(7):425–41. - PubMed
    1. Daquinag AC, Gao Z, Fussell C, Immaraj L, Pasqualini R, Arap W, et al. Fatty acid mobilization from adipose tissue is mediated by CD36 posttranslational modifications and intracellular trafficking. JCI Insight. 2021;6(17) doi: 10.1172/jci.insight.147057. - DOI - PMC - PubMed

MeSH terms

Substances