. 2025 Apr 28;21(4):e1013109.
doi: 10.1371/journal.ppat.1013109. eCollection 2025 Apr.

Variable rates of SARS-CoV-2 evolution in chronic infections

Affiliations

Variable rates of SARS-CoV-2 evolution in chronic infections

Ewan W Smith et al. PLoS Pathog. .

Abstract

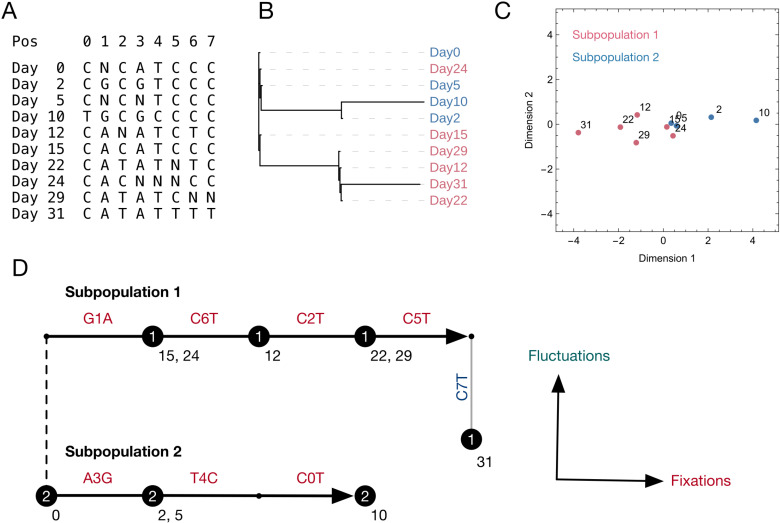
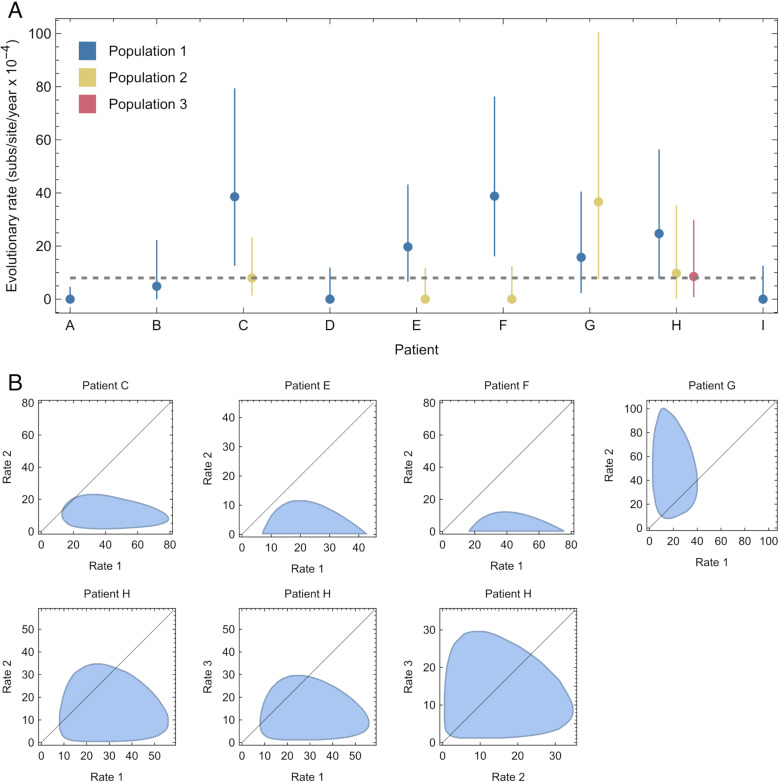
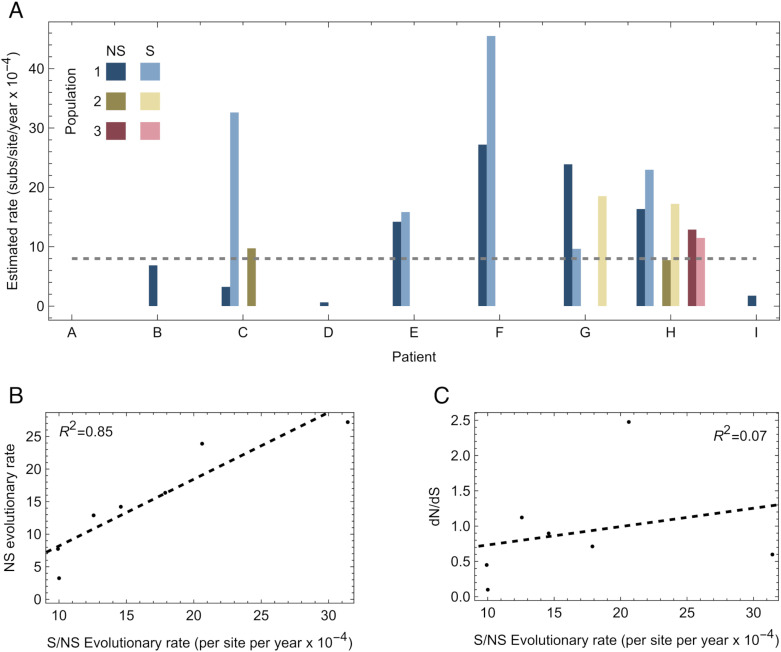
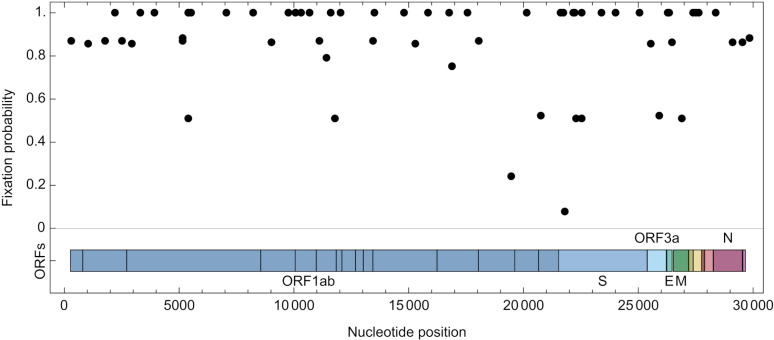
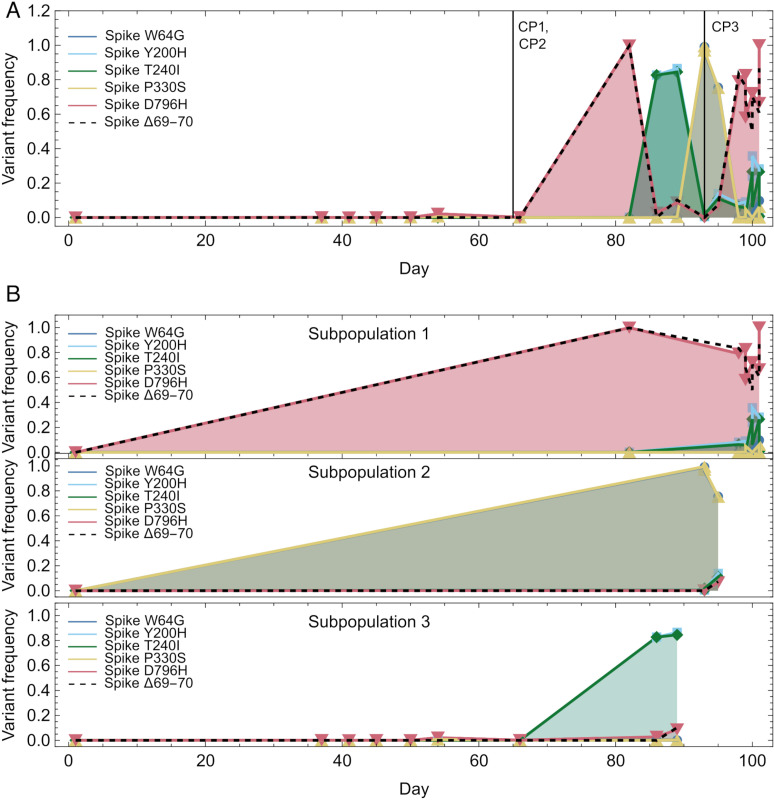
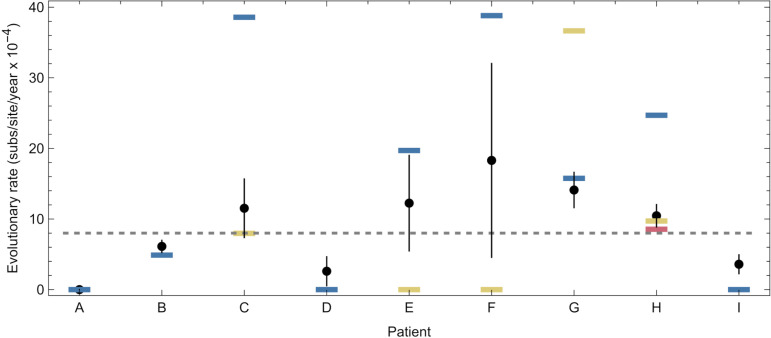
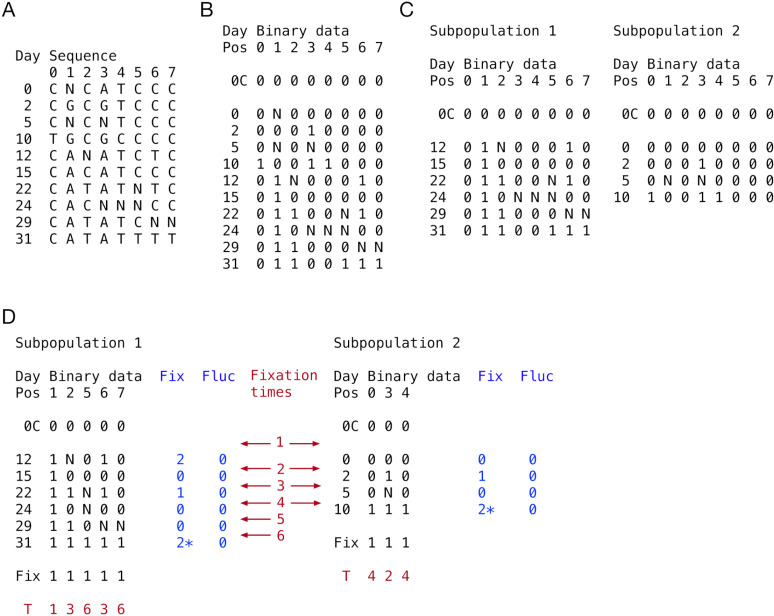
An important feature of the evolution of the SARS-CoV-2 virus has been the emergence of highly mutated novel variants, which are characterised by the gain of multiple mutations relative to viruses circulating in the general global population. Cases of chronic viral infection have been suggested as an explanation for this phenomenon, whereby an extended period of infection, with an increased rate of evolution, creates viruses with substantial genetic novelty. However, measuring a rate of evolution during chronic infection is made more difficult by the potential existence of compartmentalisation in the viral population, whereby the viruses in a host form distinct subpopulations. We here describe and apply a novel statistical method to study within-host virus evolution, identifying the minimum number of subpopulations required to explain sequence data observed from cases of chronic infection, and inferring rates for within-host viral evolution. Across nine cases of chronic SARS-CoV-2 infection in hospitalised patients we find that non-trivial population structure is relatively common, with five cases showing evidence of more than one viral population evolving independently within the host. The detection of non-trivial population structure was more common in severely immunocompromised individuals (p = 0.04, Fisher's Exact Test). We find cases of within-host evolution proceeding significantly faster, and significantly slower, than that of the global SARS-CoV-2 population, and of cases in which viral subpopulations in the same host have statistically distinguishable rates of evolution. Non-trivial population structure was associated with high rates of within-host evolution that were systematically underestimated by a more standard inference method.


Conflict of interest statement

The authors have declared that no competing interests exist

Figures

Fig 1
Fig 1. Representations of sequence data from Patient G.
A. Alignment of sequences describing variant positions in sequences from different samples. Variant positions are renumbered from 0 to 7 for simplicity. B. Phylogenetic reconstruction of sequences, created using IQTree2[45]. Sequence labels have been coloured according to the subpopulations with which they were identified by our method. C. Graphical representation of sequences, calculated by a method of dimension reduction, whereby distances in the plot are fitted to match distances between sequences in sequence space. Subpopulations detected by our method are highlighted as red and blue dots. Numbers adjacent to dots describe the time of sample collection. These representations explicitly incorporate information from ambiguous nucleotides at variant sites, leading to the potential for points to be separated by distances of less than one unit. D. Interpretation of the maximum likelihood inference derived from our method. Samples are divided into two populations, which share a consensus sequence, represented by the vertical dashed line. Each subpopulation is inferred to gain sequence variants which eventually fix in the population; these are marked in red text. Other variants observed in the population are inferred to be temporary fluctuations in the sequence consensus which do not fix in the population; these are marked in blue text. Thick black horizontal arrows show the inferred evolution of each subpopulation. Collected sequences are shown as circles, are numbered by subpopulation, and have adjacent text marking the day of collection. Sequences are understood as stochastic observations of the underlying subpopulations. In the plot sequences are placed directly upon an arrow if all the variants they describe are fixations, or adjacent to the arrow if they describe both fixation and fluctuation events. We note that variants C5T and C7T cannot be distinguished from one another in our method; the locations of these variants within our plot could be interchanged.
Fig 2
Fig 2. Inferred rates of within-host SARS-CoV-2 evolution.
A. Maximum likelihood rates of within-host evolution are shown as dots, coloured according to the population identified within an individual. Between 1 and 3 populations were identified per host from the data. Vertical lines show estimated uncertainties in each rate. The horizontal gray dashed line shows an estimate for the global rate of SARS-CoV-2 evolution. B. Uncertainties in joint estimates of rates for individuals in which more than one population was identified. The black line shows parity between rates of evolution.
Fig 3
Fig 3. Inferred rates of evolution at synonymous and non-synonymous sites.
A. Rates of evolution at synonymous and nonsynonymous sites were calculated across a statistical ensemble of model outputs. The horizontal dashed line shows an estimate of the global rate of SARS-CoV-2 evolution. B. Correlation between the inferred rate of evolution at nonsynonymous sites, and the total evolutionary rate calculated across both nonsynonymous and synonymous sites. The dashed black line shows a linear model fit to the data. C. Relationship between dN/dS and the total evolutionary rate calculated across both nonsynonymous and synonymous sites. The dashed black line shows a linear model fit to the data.
Fig 4
Fig 4. Locations in the genome of potential fixation events.
Fixation events in our model are associated with a probability, which was calculated across an ensemble of models in which changes in the viral sequence could reflect either genuine change in a population or a form of sequencing error.
Fig 5
Fig 5. Changes in allele frequencies in the data from patient H.
A. Allele frequencies of selected variants in the SARS-CoV-2 Spike protein, calculated from short-read sequence data from patient H. Vertical lines show the times of administration of three doses of convalescent plasma. B. Allele frequencies replotted according to a division of samples into subpopulations, as inferred by our method. Markers show the times of individual samples, with the first sample included in all subpopulations, representing the inferred initial consensus. Lines connecting variant frequencies are for illustration only.
Fig 6
Fig 6. Rates of evolution inferred using a simple method of linear regression.
The black dot for each patient shows an estimate of the within-host rate of virus evolution, inferred from a method of linear regression. Vertical black lines show error bars for these estimates. Blue, yellow, and red horizontal lines show the rates for the first, second, and third populations inferred by our approach. The linear regression method commonly underestimates the more rapid rates of evolution identified in structured cases of within-host evolution.
Fig 7
Fig 7. Processing of sequence data.
A. Viral genome sequences were reduced to the set of loci at which variants were found. Ambiguous nucleotides are represented by an N. Data shown are from Patient G. B. This alignment was converted into binary code, representing consensus and variant alleles. The sequence 0C represents the consensus. Variants in the genome are labelled by position, from 0 to 7. C. Sequences were split into subpopulations, each with the same consensus. One example splitting is shown, representing the optimal split for these data. Multiple alternative splittings are possible. D. Non-variant sites were removed for each subpopulation. Fixations were identified for each subpopulation, being shown via a 1 in the ‘Fix’ row below the sequence data. Timings of each fixation are shown as the interval in which they occurred (red text). For each sample after the proposed consensus, the numbers of fixations and fluctuations in that sample are shown. Fixation and fluctuation numbers, and the respective days of their observation, were used to infer rates of evolution for each subpopulation. Fixation numbers for events occurring in the final time-point are starred; these were modelled as potentially describing either fixations or fluctuations in the sequence, calculating all possible likelihoods according to Equation 4.

Similar articles

Cited by

References

    1. Markov PV, Ghafari M, Beer M, Lythgoe K, Simmonds P, Stilianakis NI, et al.. The evolution of SARS-CoV-2. Nat Rev Microbiol. 2023;21(6):361–79. doi: 10.1038/s41579-023-00878-2 - DOI - PubMed
    1. Volz E, Hill V, McCrone JT, Price A, Jorgensen D, O’Toole Á, et al.. Evaluating the effects of SARS-CoV-2 spike mutation D614G on transmissibility and pathogenicity. Cell. 2021;184(1):64-75.e11. doi: 10.1016/j.cell.2020.11.020 - DOI - PMC - PubMed
    1. Rambaut A, Loman NJ, Pybus O, Barclay WS, Barrett J, Carabelli AM, et al. Preliminary genomic characterisation of an emergent SARS-CoV-2 lineage in the UK defined by a novel set of spike mutations. 2020 Dec.
    1. Viana R, Moyo S, Amoako DG, Tegally H, Scheepers C, Althaus CL, et al.. Rapid epidemic expansion of the SARS-CoV-2 Omicron variant in southern Africa. Nature. 2022;603(7902):679–86. doi: 10.1038/s41586-022-04411-y - DOI - PMC - PubMed
    1. Hill V, Du Plessis L, Peacock TP, Aggarwal D, Colquhoun R, Carabelli AM, et al.. The origins and molecular evolution of SARS-CoV-2 lineage B.1.1.7 in the UK. Virus Evol. 2022;8(2):veac080. doi: 10.1093/ve/veac080 - DOI - PMC - PubMed