. 2025 Apr 28;21(4):e1011698.
doi: 10.1371/journal.pgen.1011698. eCollection 2025 Apr.

Meiotic divisions and round spermatid formation do not require centriole duplication in mice

Affiliations

Meiotic divisions and round spermatid formation do not require centriole duplication in mice

Marnie W Skinner et al. PLoS Genet. .

Abstract

Centrosomes, composed of centrioles and pericentriolar matrix proteins, are traditionally viewed as essential microtubule-organizing centers (MTOCs) that facilitate bipolar spindle formation and chromosome segregation during spermatogenesis. In this study, we investigated the role of centrioles in male germ cell development by using a murine conditional knockout (cKO) of Sas4, a critical component of centriole biogenesis. We found that while centriole duplication was impaired in Sas4 cKO spermatocytes, these cells were still capable of progressing through meiosis I and II. Chromosome segregation was able to proceed through the formation of a non-centrosomal MTOC, indicating that centrioles are not required for meiotic divisions. However, spermatids that inherited fewer than two centrioles exhibited severe defects in spermiogenesis, including improper manchette formation, constricted perinuclear rings, disrupted acrosome morphology, and failure to form flagella. Consequently, Sas4 cKO males were infertile due to the absence of functional spermatozoa. Our findings demonstrate that while centrioles are dispensable for meiosis in male germ cells, they are essential for spermiogenesis and sperm maturation. This work provides key insights into the role of centrosomes in male fertility and may have implications for understanding certain conditions of male infertility associated with centriole defects.


Conflict of interest statement

I have read the journal's policy and the authors of this manuscript have the following competing interests: PWJ is on the scientific advisory board of Gameto, Inc. All other authors have no competing interests to disclose.

Figures

Fig 1
Fig 1. Depletion of SAS4 in spermatocytes leads to male infertility.
A. Diagram of the Sas4 cKO allele before and after Cre-mediated recombination. The Sas4 flox allele harbors two loxP sites (blue triangle) flanking exon 5 (grey box). Excision of exon 5 by Cre recombinase results in the Sas4 deletion allele (Sas4 del allele). B. The Spo11 promoter used to drive Cre recombinase expression in the Sas4 cKO mouse model is expressed in early meiotic prophase at ~ 9 dpp. C. Quantification of the average testis to body weight ratio of control and Sas4 cKO mice. Measurements were performed using ≥ 3 mice for 21, 24, 25, 27, 34, and 64 dpp. P values for 21, 24, 25, 27, 34, and 64 dpp were 0.1161, 0.3504, 0.1699, 0.5200, 0.0536, and 0.1143, respectively. Error bars show mean ± SEM. P values obtained from two-tailed Student’s t-test. n.s. (not significant). D. H&E staining of 5 µm thick testis sections of 44 dpp control and Sas4 cKO mice. Black arrow indicates flagella located in the lumen of the seminiferous tubules. Scale bar = 80 µm. E. Quantification of the average lumen diameter to tubule diameter ratio in control and Sas4 cKO mice. The average tubule diameter was 326.75 µm and 434.05 µm in control and Sas4 cKO mice, respectively. The average tubule lumen diameter was 116.10 µm and 185.38 µm in control and Sas4 cKO mice, respectively. Quantification was performed in three biological replicates with ≥33 tubules quantified per replicate. The total number of tubules measured for the control and Sas4 cKO was 100 each. P value = < 0.0001. Error bars show mean ± 95% CI. P values obtained from two-tailed Student’s t-test. ****P < 0.0001. F. H&E staining of 5 µm thick epididymides sections of 226 dpp control and Sas4 cKO mice. Scale bar = 80 µm. G. Epididymal sperm count in control and Sas4 cKO mice, respectively. The average sperm count was 255,833 sperm/mL and 2,583 sperm/mL in control and Sas4 cKO epididymides, respectively. Quantification was performed using three biological replicates. P value = 0.0008. Error bars show mean ± SEM. P values obtained from two-tailed Student’s t-test. n.s. ***P < 0.001.
Fig 2
Fig 2. Characterization of meiotic prophase progression and crossover formation.
A. Prophase I control and Sas4 cKO spermatocytes from 14 and 20 dpp mice were immunolabeled against γ-H2AX (cyan), SYCP3 (red and grey outset below corresponding image), and stained with DAPI (grey outset below corresponding image). Scale bars = 10 µm. B. Representative images of mid-prophase I spermatocytes in 20 dpp control and Sas4 cKO mice immunolabeled against SYCP3 (red), MLH1 (cyan), and stained with DAPI (grey outset to the right of corresponding image). Scale bars = 10 µm. C. Quantification of MLH1 foci observed along SYCP3 stretches during pachynema in both control and Sas4 cKO spermatocytes. The total number of cells quantified for control and Sas4 cKO mice were 33 and 34, respectively. P value = 0.7069. Error bars show mean ± 95% CI. P values obtained from two-tailed Student’s t-test. n.s. (not significant).
Fig 3
Fig 3. Spermatocytes successfully form bipolar spindles and complete chromosome segregation despite centriole duplication failure.
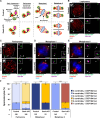
A. Leptonema and zygonema stage control and Sas4 cKO spermatocytes from 13 dpp mice expressing CETN2-GFP were immunolabeled against PCNT (red) and SYCP3 (blue) and stained with DAPI (grey outset). Zoomed images of the centrioles are outset to the right of the corresponding images. The white arrowheads indicate the centrioles. The green number indicates the total number of centrioles per cell. Scale bars = 5 µm. B. Quantification of centriole foci observed during leptonema and zygonema in both control and Sas4 cKO spermatocytes. The total number of cells quantified for control and Sas4 cKO mice were 243 and 293, respectively. P values for leptonema and zygonema were 0.0771 and < 0.0001, respectively. Error bars show mean ± SEM. P values obtained from two-tailed Student’s t-test. n.s. (not significant), ****P < 0.0001. C. Metaphase I control and Sas4 cKO spermatocytes from 23-27 dpp mice were immunolabeled against CETN3 (green), α-tubulin (red) and stained with DAPI (blue). Zoomed images of the centrioles are outset to the right of the corresponding images. The white arrowheads indicate the centrioles. The green number indicates the total centrioles per cell. Scale bars = 5 µm. D. Quantification of centriole foci observed during metaphase I and metaphase II in both control and Sas4 cKO spermatocytes. Immunolabeling was performed on ≥ 3 biological replicates, with ≥ 30 spermatocytes quantified per replicate. The total number of cells quantified for control and Sas4 cKO mice were 329 and 231, respectively. P values for metaphase I and metaphase II were <0.0001 and < 0.0001, respectively. Error bars show mean ± SEM. P values obtained from two-tailed Student’s t-test. ****P < 0.0001. E. Metaphase II control and Sas4 cKO spermatocytes from 23-27 dpp mice were immunolabeled against CETN3 (green), α-tubulin (red) and stained with DAPI (blue). Zoomed images of the centrioles are outset to the right of the corresponding images. The white arrowheads indicate the centrioles. The white arrow indicates the acentriolar spindle pole. The green number indicates the total centrioles per cell. Scale bars = 5 µm. F. Diagram illustrating how Sas4 cKO leads to centriole duplication failure during meiosis. As a result, metaphase I spermatocytes were observed to harbor one centriole at each bipolar spindle pole and metaphase II spermatocytes were observed to harbor a single centriole at one of the two bipolar spindle poles. Red rectangle with rounded corners = mature parent centriole, pink rectangle with rounded corners = immature parent centriole, green bar = maturation marker, yellow oval = PCM, green oval = SAS4, red X = indicates depletion, grey rectangle with rounded corners = new centriole from first centriole duplication, yellow rectangle with rounded corners = new centrioles from second centriole duplication, blue oval = DNA, red lines = microtubules.
Fig 4
Fig 4. Centriole maturation is unaffected by SAS4 depletion.
A. Diagram illustrating how Sas4 cKO does not affect centriole maturation. As a result, all observed centrioles in Sas4 cKO spermatocytes are mature by metaphase I and metaphase II. Red rectangle with rounded corners = mature parent centriole, pink rectangle with rounded corners = immature parent centriole, green bar = maturation marker, yellow oval = PCM, green oval = SAS4, red X = indicates depletion, grey rectangle with rounded corners = new centriole from first centriole duplication, yellow rectangle with rounded corners = new centrioles from second centriole duplication, blue oval = DNA, red lines = microtubules. B. Leptotene stage control and Sas4 cKO spermatocytes from 12 dpp mice harboring CETN2-GFP (green) were immunolabeled against SYCP3 (red) and CEP164 (purple) and stained with DAPI (grey inset). Zoomed images of the centrioles are inset on corresponding images. The white arrowheads indicate the centrosome. The dashed line outlines the DAPI signal. The green number indicates the total centrioles per cell. The magenta number indicates the total number of CEP164 foci per cell. Scale bars = 5 µm. C. Pachytene stage control and Sas4 cKO spermatocytes from 23-27 dpp mice harboring CETN2-GFP (green) were immunolabeled against SYCP3 (red) and CEP164 (purple) and stained with DAPI (grey inset). Zoomed images of the centrioles are inset on corresponding images. The white arrowheads indicate the centrosome. The dashed line outlines the DAPI signal. The green number indicates the total centrioles per cell. The magenta number indicates the total number of CEP164 foci per cell. Scale bars = 5 µm. D. Metaphase I control and Sas4 cKO spermatocytes from 23-27 dpp mice harboring CETN2-GFP (green) were immunolabeled against α-tubulin (red) and CEP164 (purple) and stained with DAPI (blue). Zoomed images of the centrioles are inset on corresponding images. The white arrowheads indicate the centrosome. The green number indicates the total centrioles per cell. The magenta number indicates the total number of CEP164 foci per cell. Scale bars = 5 µm. E. Metaphase II control and Sas4 cKO spermatocytes from 23-27 dpp mice harboring CETN2-GFP (green) were immunolabeled against α-tubulin (red) and CEP164 (purple) and stained with DAPI (blue). Zoomed images of the centrioles are inset on corresponding images. The white arrowheads indicate the centrosome. The white arrows indicate non-centrosomal MTOC (ncMTOC). The green number indicates the total centrioles per cell. The magenta number indicates the total number of CEP164 foci per cell. Scale bars = 5 µm. F. Quantification and localization of CEP164 foci in relation to centrioles in control and Sas4 cKO pachytene, metaphase I, and metaphase II stage spermatocytes. Immunolabeling was performed on 3 biological replicates with ≥ 30 spermatocytes quantified per replicate. The total number of cells quantified for control and Sas4 cKO mice were 447 and 357, respectively. P values for pachynema, metaphase I, and metaphase II were 0.0179, < 0.0001, and < 0.0001, respectively. Error bars show mean ± SEM. P values obtained from two-tailed Student’s t-test. *P < 0.05, ****P < 0.0001.
Fig 5
Fig 5. Secondary spermatocytes utilize a ncMTOC for bipolar spindle formation.
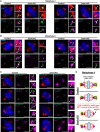
A. Metaphase I control and Sas4 cKO spermatocytes from 23-27 dpp mice were immunolabeled against CETN3 (green), α-tubulin (red), and CEP192, or GCP2 (purple) and stained with DAPI (blue). Zoomed images of the centrioles are outset to the right of the corresponding images. The white arrowheads indicate the centrosome. Scale bars = 5 µm. B. Metaphase II control and Sas4 cKO spermatocytes from 23-27 dpp mice were immunolabeled against CETN3 (green), α-tubulin (red), and CEP192, or GCP2 (purple) and stained with DAPI (blue). Zoomed images of the centrioles are outset to the right of the corresponding images. The white arrowheads indicate the centrosome. The white arrows indicate the ncMTOC. Scale bars = 5 µm. C. Metaphase II control and Sas4 cKO spermatocytes from 23-27 dpp mice expressing CETN2-GFP were immunolabeled against α-tubulin (red), TPX2, CAMSAP1, NuMA, and KIF11 (purple) and stained with DAPI (blue). Zoomed images of the centrioles are outset to the right of the corresponding images. The white arrowheads indicate the centrosome. The white arrows indicate the ncMTOC. Scale bars = 5 µm. D. Diagram illustrating the localization of MT associated factors to the centrosome and ncMTOC during metaphase II in control and Sas4 cKO spermatocytes. Red rectangle with rounded corners = original mature parent centriole, pink rectangle with rounded corners = original immature parent centriole, grey rectangle with rounded corners = new centriole from first centriole duplication, yellow rectangle with rounded corners = new centrioles from second centriole duplication, green bar = maturation marker, yellow oval = PCM, purple star = MT associated factors, blue oval = DNA, red lines = microtubules.
Fig 6
Fig 6. Round and elongating spermatids form with less than two centrioles.
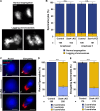
A. Representative images of normal chromosome segregation and chromosome missegregation events during anaphase II spermatocytes stained with DAPI. The white arrows indicate the lagging chromosome event. Scale bars = 5 µm. B. Quantification of lagging chromosomes in anaphase I and II spermatocytes. Immunolabeling was performed on 5 biological replicates with ≥ 20 spermatocytes quantified per replicate. The total number of cells quantified for control and Sas4 cKO mice was 212 and 203, respectively. P values for anaphase I and anaphase II were 0.9655 and 0.7566, respectively. Error bars show mean ± SEM. P values obtained from two-tailed Student’s t-test. n.s. (not significant). C. Control and Sas4 cKO round and elongating spermatids from 28-36 dpp mice expressing CETN2-GFP (green) were immunolabeled against α-tubulin (red) and stained with DAPI (blue). The white arrowheads indicate the centrioles. Scale bars = 5 µm. D. Quantification of CETN2-GFP foci in control and Sas4 cKO round spermatids. Immunolabeling was performed on 3 biological replicates with ≥ 50 spermatocytes quantified per replicate. The total number of cells quantified for control and Sas4 cKO mice were 180 and 205, respectively. P value = < 0.0001. Error bars show mean ± SEM. P values obtained from two-tailed Student’s t-test. ****P < 0.0001. E. Quantification of CETN2-GFP foci in control and Sas4 cKO elongating spermatids. Immunolabeling was performed on 3 biological replicates with ≥ 50 spermatocytes quantified per replicate. The total number of cells quantified for control and Sas4 cKO mice were 179 and 178, respectively. P value = < 0.0001. Error bars show mean ± SEM. P values obtained from two-tailed Student’s t-test. ****P < 0.0001.
Fig 7
Fig 7. Aberrant spermiogenesis is observed in spermatids that inherit less than two centrioles.
A. Representative images of control and Sas4 cKO spermatids at progressive steps of spermiogenesis from 27-36 dpp mice. Spermatids were immunolabeled against lectin-PNA (yellow) and stained with DAPI (blue). Immunolabeling against lectin-PNA allowed for the characterization of the acrosome during spermiogenesis, which is a structure that develops to cover the proximal end of the spermatid head and is necessary for fertility. Scale bars = 5 µm. B. Quantification of acrosome diameter in control and Sas4 cKO spermatids at steps 8 and 9 of spermiogenesis. Immunolabeling against lectin-PNA and measurement of acrosome diameter was performed on 3 biological replicates with ≥ 15 spermatocytes quantified per replicate. The average diameter of the acrosome in step 8 spermatids was 6.51 µm and 6.50 µm in control and Sas4 cKO mice, respectively. The average diameter of the acrosome in step 9 spermatids was 8.95 µm and 5.87 µm in control and Sas4 cKO mice, respectively. The total number of cells quantified for control and Sas4 cKO mice were 169 and 154, respectively. P values for step 8 and step 9 acrosome diameters were 0.8947 and < 0.0001, respectively. Error bars show mean ± 95% CI. P values obtained from two-tailed Student’s t-test. n.s. (not significant), ****P < 0.0001. C. Representative images of control and Sas4 cKO spermatids at progressive steps of spermiogenesis from 27-36 dpp mice. Spermatids were immunolabeled against α-tubulin (yellow) and stained with DAPI (blue). Immunolabeling against α-tubulin allowed for assessment of the manchette morphology, a MT based protein trafficking structure critical for successful cellular remodeling during spermiogenesis. Scale bars = 5 µm. D. Quantification of manchette MT length in control and Sas4 cKO spermatids at steps 9-10 and 11-12 of spermiogenesis. Immunolabeling against α-tubulin and measurement of MT length was performed on 3 biological replicates with ≥ 30 spermatocytes quantified per replicate. The average length of manchette MTs in step 9-10 spermatids was 5.53 µm and 6.84 µm in control and Sas4 cKO mice, respectively. The average length of manchette MTs in step 11-12 spermatids was 3.94 µm and 8.37 µm in control and Sas4 cKO mice, respectively. The total number of cells quantified for control and Sas4 cKO mice were 247 and 284, respectively. P values for step 9-10 and step 11-12 MT lengths were <0.0001 and < 0.0001, respectively. Error bars show mean ± 95% CI. P values obtained from two-tailed Student’s t-test. ****P < 0.0001. E. Representative images of control and Sas4 cKO spermatids at progressive steps of spermiogenesis from 27-36 dpp mice. Spermatids were immunolabeled against CCDC13 (yellow) and stained with DAPI (blue). CCDC13 is a protein shown to localize to the perinuclear ring in elongating spermatids. The perinuclear ring helps stabilize the manchette MTs and promote successful protein trafficking. CCDC13 is also associated with the centrosome and localizes to the neck region in spermatids. Assessment of the perinuclear ring and CCDC13 localization to the neck region helped determine the fidelity of the protein trafficking in spermatids and indicate the attachment of the tail to the spermatid head, respectively. Scale bars = 5 µm. F. Quantification of perinuclear ring diameter in control and Sas4 cKO spermatids at steps 9 and 10 of spermiogenesis. Immunolabeling against CCDC13 and measurement of perinuclear ring diameter was performed on 3 biological replicates with ≥ 30 spermatocytes quantified per replicate. The average diameter of the perinuclear ring in step 9 spermatids was 7.75 µm and 7.66 µm in control and Sas4 cKO mice, respectively. The average diameter of the perinuclear ring in step 10 spermatids was 9.35 µm and 5.81 µm in control and Sas4 cKO mice, respectively. The total number of cells quantified for control and Sas4 cKO mice were 208 and 205, respectively. P values for step 9 and step 10 acrosome diameters were 0.4548 and < 0.0001, respectively. Error bars show mean ± 95% CI. P values obtained from two-tailed Student’s t-test. n.s. (not significant), ****P < 0.0001. G. Quantification of CCDC13 localization to the neck region in control and Sas4 cKO spermatids at steps 9 and 10 of spermiogenesis. Immunolabeling against CCDC13 was performed on 3 biological replicates with ≥ 30 spermatocytes quantified per replicate. The percentage of spermatids with CCDC13 foci in the neck region in step 9 was 98% and 32% in control and Sas4 cKO mice, respectively. The percentage of spermatids with CCDC13 foci in the neck region in step 10 was 100% and 17% in control and Sas4 cKO mice, respectively. The total number of cells quantified for control and Sas4 cKO mice were 209 and 204, respectively. P values for step 9 and step 10 spermatids were ****P < 0.0001 and ****P < 0.0001, respectively. Error bars show mean ± SEM. P values obtained from two-tailed Student’s t-test. ****P < 0.0001. H. Control and Sas4 cKO spermatozoa were immunolabeled against δ-tubulin (red) and stained with DAPI (blue, and a grey inset in the lower left corner to highlight DNA morphology). The white arrow indicates the flagella. Scale bars = 5 µm. I. Control and Sas4 cKO spermatozoa were immunolabeled against lectin-PNA (green), acetylated tubulin (red), and stained with DAPI (blue, and a grey inset in the lower left corner to highlight DNA morphology). The white arrow indicates the flagella. Scale bars = 5 µm.
Fig 8
Fig 8. Spermatids require two centrioles for successful spermiogenesis.
A. Diagram illustrating centriole duplication in control and Sas4 cKO spermatocytes during spermatogenesis. In control spermatocytes, centrioles undergo duplication during late leptonema. By metaphase I, each spindle pole contains two mature centrioles and both PCM MT-associated proteins. By metaphase II, each spindle pole now only contains one mature centriole and one immature centriole in addition to the PCM and MT-associated proteins. Each resulting round spermatid inherits a complete centrosome with one mature and one immature centriole that will progress after meiosis to form fully mature spermatids. This is presented as a remodeled head structure and attached flagella. In the Sas4 cKO spermatocytes, the first centriole duplication fails, leading to metaphase I spermatocytes with only one mature centriole at each bipolar spindle pole (PCM and ncMTOC proteins are also present). The second centriole duplication event also fails, leading to metaphase II spermatocytes with one mature centriole at one spindle pole and no centriole at the other pole. At the spindle pole without a centriole, there are only ncMTOC proteins, not PCM proteins. This leads to half of Sas4 cKO round spermatids inheriting a single mature centriole and half inheriting no centrioles. As a result, spermatid remodeling is unsuccessful and leads to mishappen head formation and a lack of flagella. Red rectangle with rounded corners = original mature parent centriole, pink rectangle with rounded corners = original immature parent centriole, grey rectangle with rounded corners = new centrioles from first centriole duplication event, yellow rectangle with rounded corners = new centrioles from second centriole duplication event, green bar = maturation marker, green oval = basal centriole, dark red oval = centriole adjunct, yellow oval = PCM, yellow and purple oval = PCM and MT associated proteins, purple oval = microtubule-associated proteins, blue = DNA, red lines = microtubules, orange = flagella. B. Diagram illustrating the progression of control and Sas4 cKO spermatids through spermiogenesis. Control round spermatids inherit two centrioles, one mature and one immature. As they progress through spermiogenesis, they undergo nuclear remodeling and DNA compaction. This process is mediated by the transient protein trafficking structure present in step 9-12 spermatids, the manchette. The manchette MTs are stabilized at their plus ends by the perinuclear ring that forms at the hemisphere of the spermatid head and is visible during steps 9 to 12. The centriole adjunct, formed from the immature centriole, serves as both the nucleation site for the manchette MTs and facilitates the head-tail attachment. The mature centriole serves as the base for flagella axoneme extension. Throughout this process, the spermatid also develops an acrosome consisting of proteins necessary for fertilization. The acrosome proteins first accumulate at a localized region at the proximal end of the spermatid (steps 1-7) that continues to expand to cover the entire top half of the sperm head by the end of spermiogenesis (steps 8-16). Sas4 cKO spermatids either inherit only one mature centriole or no centriole. When one mature centriole is inherited, MT extension from the mature centriole, or basal body, is executed to form the flagella. However, the immature centriole is not present to form the centriole adjunct necessary for serving as the base for manchette MT nucleation and ensuring the attachment of the flagella to the sperm head. Therefore, flagella without a proper attachment to the head are lost. When Sas4 cKO spermatids inherit no centrioles, they display similar defects as spermatids that inherit one mature centriole. In addition, because they lack the mature centriole they cannot form flagella. As a result, by steps 13-16, all Sas4 cKO spermatids exhibit misshaped DNA, abnormal acrosome morphology, and lack flagella. Grey rectangle with rounded corners = mature centriole, green bar = maturation marker, yellow rectangle with rounded corners = immature centriole, yellow and purple oval = PCM and MT associated proteins, purple oval = microtubule-associated proteins, green oval = basal centriole, dark red oval = centriole adjunct, blue = DNA, pink = flagella, lime green = acrosome, yellow = manchette, red = CCDC13.

Similar articles

References

    1. Reiter JF, Leroux MR. Genes and molecular pathways underpinning ciliopathies. Nat Rev Mol Cell Biol. 2017;18(9):533–47. doi: 10.1038/nrm.2017.60 - DOI - PMC - PubMed
    1. Focșa IO, Budișteanu M, Bălgrădean M. Clinical and genetic heterogeneity of primary ciliopathies (Review). Int J Mol Med. 2021;48(3):176. doi: 10.3892/ijmm.2021.5009 - DOI - PMC - PubMed
    1. Avidor-Reiss T, Mazur M, Fishman EL, Sindhwani P. The Role of Sperm Centrioles in Human Reproduction - The Known and the Unknown. Front Cell Dev Biol. 2019;7:188. doi: 10.3389/fcell.2019.00188 - DOI - PMC - PubMed
    1. Wu B, Gao H, Liu C, Li W. The coupling apparatus of the sperm head and tail†. Biol Reprod. 2020;102(5):988–98. doi: 10.1093/biolre/ioaa016 - DOI - PubMed
    1. Tsang SH, Aycinena ARP, Sharma T. Ciliopathy: Usher Syndrome. Adv Exp Med Biol. 2018;1085:167–70. doi: 10.1007/978-3-319-95046-4_32 - DOI - PubMed

Substances

LinkOut - more resources