. 2025 Jul 1;6(4):307-324.
doi: 10.1158/2643-3230.BCD-24-0342.

Single-cell Transcriptional Atlas of Human Hematopoiesis Reveals Genetic and Hierarchy-Based Determinants of Aberrant AML Differentiation

Affiliations

Single-cell Transcriptional Atlas of Human Hematopoiesis Reveals Genetic and Hierarchy-Based Determinants of Aberrant AML Differentiation

Andy G X Zeng et al. Blood Cancer Discov. .

Abstract

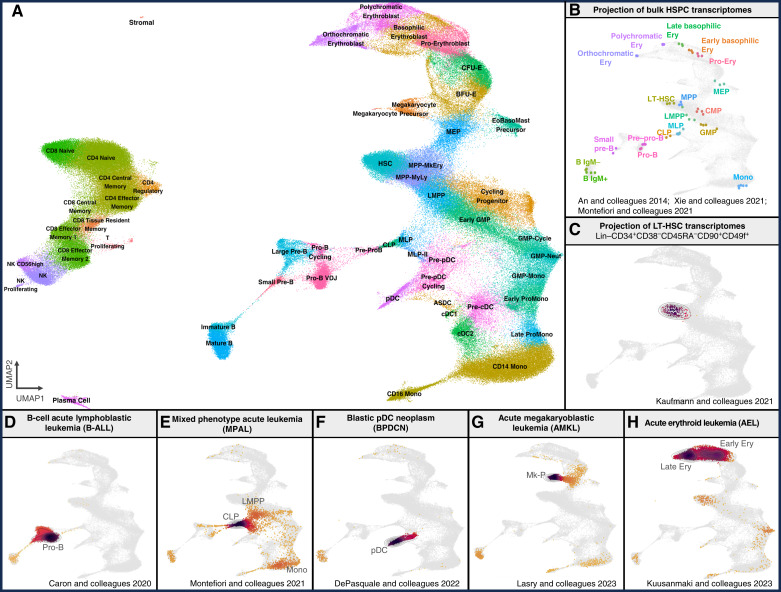
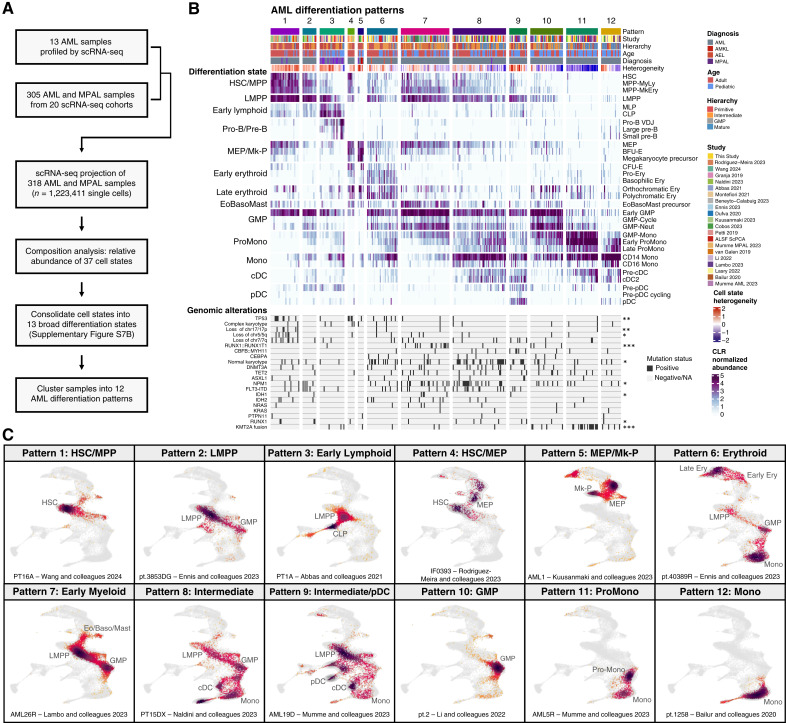
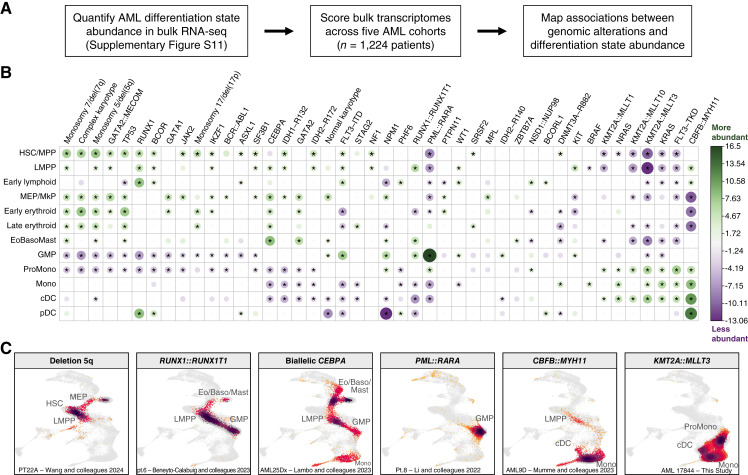
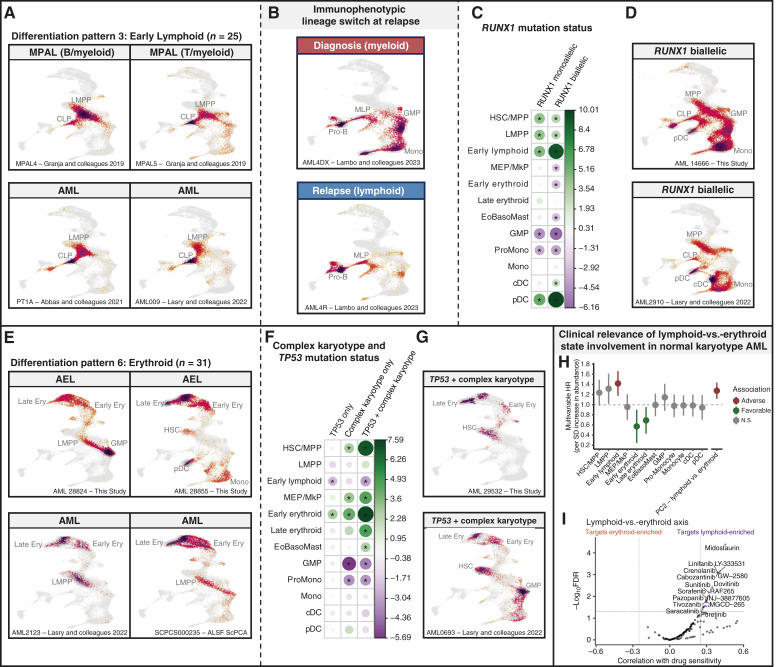
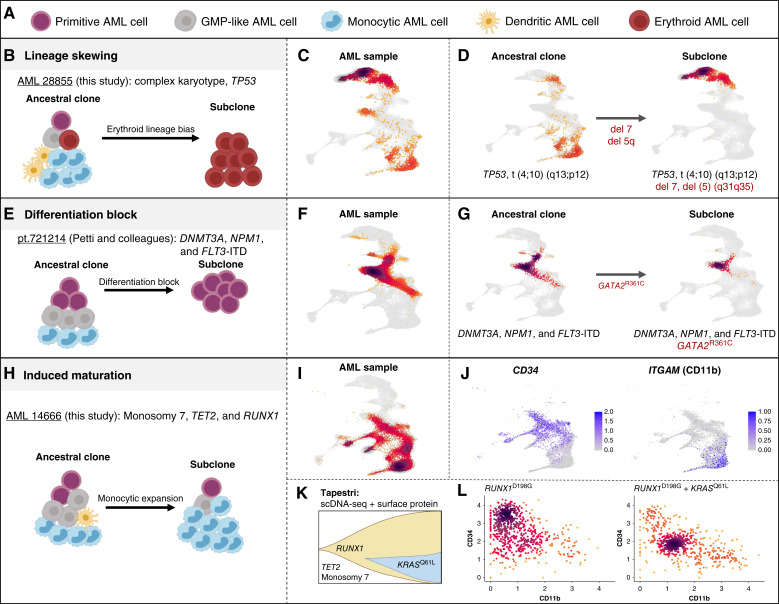
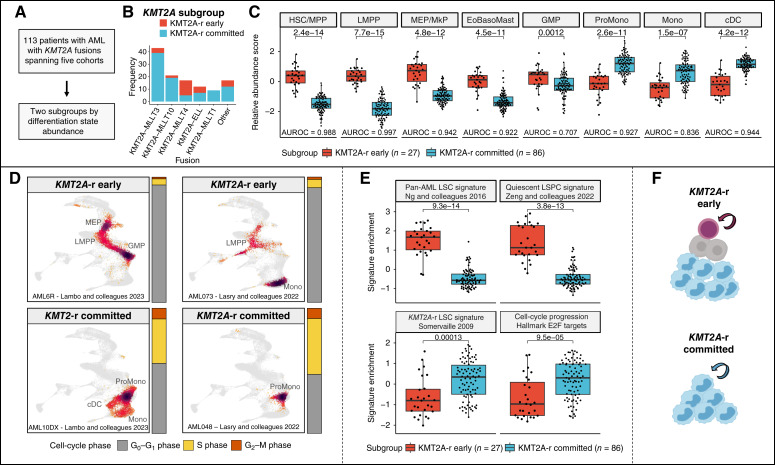
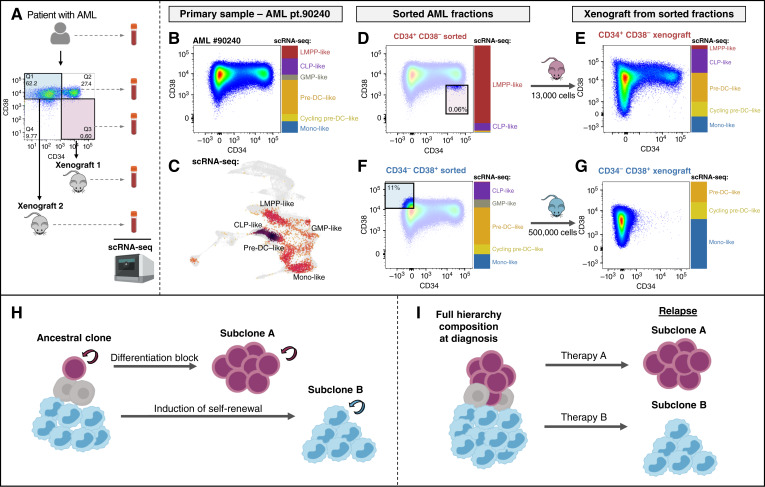
Therapeutic targeting of acute myeloid leukemia (AML) is hampered by intra- and inter-tumoral cell state heterogeneity. To develop a more precise understanding of AML cell states, we constructed a reference atlas of human hematopoiesis from 263,159 single-cell transcriptomes spanning 55 cellular states. Using this atlas, we mapped more than 1.2 million cells spanning 318 leukemia samples, revealing 12 recurrent patterns of aberrant differentiation in AML. Notably, this uncovered unexpected AML cell states resembling lymphoid and erythroid progenitors that were prognostic within the clinically heterogeneous context of normal karyotype AML, independent of genomic classifications. Systematic mapping of genotype-to-phenotype associations revealed specific differentiation landscapes associated with more than 45 genetic drivers. Importantly, distinct cellular hierarchies can arise from samples sharing the same genetic driver, potentially reflecting distinct cellular origins for disease-sustaining leukemia stem cells. Thus, precise mapping of malignant cell states provides insights into leukemogenesis and refines disease classification in acute leukemia.

Significance: We present a single-cell reference atlas of human hematopoiesis and a computational tool for rapid mapping and classification of healthy and leukemic cells. Applied to AML, this has enabled single-cell analysis at the scale of hundreds of patient samples, revealing the full breadth of derailment of differentiation in AML. See related commentary by Berger and Penter, p. 280.


Conflict of interest statement

I. Iacobucci reports other support from Arima Genomics, Mission Bio, and Takara outside the submitted work. J.A. Kennedy reports personal fees from Novartis outside the submitted work. C.G. Mullighan reports grants from the NCI and Alex’s Lemonade Stand Foundation for Childhood Cancer during the conduct of the study, as well as personal fees from Illumima and Amgen and grants from Pfizer outside the submitted work. J.E. Dick reports grants from Celgene/Bristol Myers Squibb and other support from Trillium Therapeutics/Pfizer outside the submitted work. No disclosures were reported by the other authors.

Figures

Figure 1.
Figure 1.
A single-cell reference landscape of human BM hematopoiesis. A, BoneMarrowMap, a single-cell transcriptional atlas of human hematopoiesis with balanced representation of CD34+ stem and progenitor cells together with terminally differentiated populations, comprising 263,159 BM cells spanning 55 cell states across 45 donors from six scRNA-seq datasets (–37). Supplementary Table S1 contains the complete, unabbreviated names for each cell state. B, BoneMarrowMap projection of bulk transcriptomes from purified hematopoietic cell populations from three studies (–40). C, Projection of scRNA-seq profiles from immunophenotypic long-term hematopoietic stem cells (LT-HSCs; Lin-CD34+CD38CD45RACD90+CD49f+) from Kaufmann and colleagues (41). Projected cells are shown in red and positioned based on their transcriptional similarity to reference cells (gray) from the BoneMarrowMap reference atlas. Color intensity reflects the density of projected cells mapping to a specific area. D–H, Projection of scRNA-seq profiles from leukemia samples spanning multiple diagnoses, including (D) B-cell acute lymphoblastic leukemia (B-ALL; ref. 49), (E) mixed phenotype acute leukemia (MPAL; ref. 39), (F) blastic pDC neoplasm (BPDCN; ref. 50), (G) acute megakaryoblastic leukemia (AMKL; ref. 21), and (H) acute erythroid leukemia (AEL; ref. ​51). See Supplementary Tables S1-S2 for markers used to define cell populations.
Figure 2.
Figure 2.
Projection and classification of single-cell transcriptomes in acute leukemia. A, Cell state projection and composition analysis of scRNA-seq profiles from 318 samples, including 300 AML and 18 MPAL samples, to identify recurrent patterns of AML differentiation. B, Twelve AML differentiation patterns identified through cell state projection and composition analysis. The heatmap depicts the centered log ratio (CLR)–normalized abundance of individual cell states within each patient sample clipped at 0 and 4.5 for visualization purposes. These cell states are grouped into broader differentiation states displayed on the left of the heatmap. Each sample is annotated based on the study of origin (, , –, , , –56), AML hierarchy classification from deconvolution of pseudo-bulk RNA profiles, pediatric or adult age group, and specific disease diagnosis spanning AML, MPAL, AMKL, and AEL. A measure of cell state heterogeneity is also depicted for each patient sample, quantified by the Shannon diversity index. Recurrent genomic alterations are also annotated for each patient sample with significance values derived through χ2 tests. C, scRNA-seq projection results of representative patient samples for each of the 12 AML differentiation patterns. *, P < 0.05; **, P < 0.01; ***, P < 0.001. Supplementary Table S1 contains the complete, unabbreviated names for each cell state.
Figure 3.
Figure 3.
Associations between genetic driver alterations and AML differentiation. A, Mapping the relationship of genomic alterations with AML differentiation through bulk transcriptomic quantification of AML differentiation states across adult and pediatric 1,224 samples from patients with AML from five cohorts re-analyzed by Severens and colleagues (ref. ; The Cancer Genome Atlas, BeatAML2, Leucegene, TARGET, and Leiden University Medical Centre; refs. , –60, 62). B, Association between inferred abundance of AML differentiation states with genomic alterations across 1,224 AML samples profiled by RNA-seq. The strength of each association, quantified as the test statistic from a generalized linear model adjusting for cohort as a covariate, is depicted through the size and color intensity of each dot, with green denoting higher abundance and purple denoting lower abundance. Only associations with unadjusted P < 0.05 by the likelihood ratio test are shown, and associations with FDR < 0.05 are starred. Boxes lacking colored circles denote non-significant associations at unadjusted P > 0.05. C, scRNA-seq projection results of representative patient samples for common genomic alterations in AML. Examples span multiple studies (, , –27) from our single-cell meta-analysis. Supplementary Table S1 contains the complete, unabbreviated names for each cell state. Supplementary Table S9 defines the AML differentiation states.
Figure 4.
Figure 4.
Genetic determinants and clinical relevance of lymphoid and erythroid progenitor states in AML. A, scRNA-seq projections for representative samples of patients with AML and MPAL (19, 21, 37) from differentiation pattern 3, enriched for early lymphoid states. B, scRNA-seq projection of a sample from an infant patient with AML carrying a KMT2A::AFF3 fusion (26), belonging to differentiation pattern 3, that has undergone an immunophenotypic lineage switch from myeloid to lymphoid from initial diagnosis to disease relapse following chemotherapy treatment with cytarabine, daunorubicin, and etoposide, with the addition of bortezomib. Flow cytometry data from this sample (PAWHKK) can be found in the original Lambo and colleagues (26) study. C, Association between inferred abundance of AML differentiation states with RUNX1 mutations (n = 87 monoallelic; n = 32 biallelic) across 1,224 patients with AML profiled by RNA-seq. The strength of each association, quantified as the test statistic from a generalized linear model adjusting for cohort as a covariate, is depicted through the size and color intensity of each dot, in which green denotes higher abundance and purple denotes lower abundance. Associations with FDR < 0.05 by the likelihood ratio test are starred. D, scRNA-seq projections for representative patient samples for AML with biallelic RUNX1 mutations. E, scRNA-seq projections for representative samples of patients with AML and AEL from differentiation pattern 6, enriched for early erythroid states. F, As with (C), instead depicting the associations of AML differentiation states with TP53 only (n = 16), complex karyotype only (n = 95), or TP53 + complex karyotype (n = 85) mutation status compared with wild-type samples. G, Representative patient samples for AML with complex karyotype and TP53 mutations. H, Survival outcome association for 180 normal karyotype patients with AML with complete survival and clinical annotations from BeatAML2 and The Cancer Genome Atlas. Separate survival analyses were performed for each AML differentiation state as well as for the lymphoid-versus-erythroid axis. For each variable of interest, multivariable Cox models were fit on overall survival with the following covariates: age, sex, blast percentage, and mutation statuses for NPM1, FLT3-ITD, CEBPA-bZIP, TP53, RUNX1, and MDS-related genes (ASXL1, BCOR, EZH2, RUNX1, SF3B1, SRSF2, STAG2, U2AF1, or ZRSR2). Adjusted HRs from multivariable analysis are reported for each SD increase in inferred abundance, with error bars depicting the 95% confidence interval represented as the adjusted HR ± 1.96 SE. I, Volcano plot of Pearson correlations between the lymphoid-versus-erythroid axis (PC2) and ex vivo drug sensitivities from 123 normal karyotype AML samples from BeatAML2, identifying drugs targeting lymphoid-enriched AML versus erythroid-enriched AML. Supplementary Table S1 contains the complete, unabbreviated names for each cell state. Supplementary Table S9 defines the AML differentiation states.
Figure 5.
Figure 5.
Impact of genetic subclones on AML differentiation. A, Graphical representation of broad differentiation states within AML samples. Cell type icons are from BioRender. B–D, Example of lineage skewing from myeloid to erythroid at the subclonal level, depicting projection results from (C) the primary AML sample and from (D) an ancestral clone involving t(4;10) and an erythroid-restricted subclone involving t(4;10), del(5q), and monosomy 7. E–G, Example of an AML sample (16) with a primitive differentiation block at the subclonal level, depicting projection results from (F) the primary AML sample and from (G) an ancestral GATA2 wild-type clone and an HSC/MPP-restricted GATA2-mutant subclone. H–L, Example of induced maturation of AML cells at the subclonal level, depicting projection results from (I) the primary AML sample, in which (J) primitive stem and progenitor cells express CD34 and mature myeloid cells express ITGAM (encoding CD11b). K, Simultaneous scDNA-seq and quantification of surface protein levels of this AML sample by the Mission Bio Tapestri platform reveals an ancestral clone with monosomy 7 and TET2 and RUNX1 mutations with a subclonal KRAS-mutant clone. L, Surface protein levels quantified by Tapestri reveal the RUNX1-mutant ancestral clone to be mostly primitive (CD34+CD11b) and the KRAS-mutant subclone to be mostly mature (CD34CD11b+).
Figure 6.
Figure 6.
Heterogeneous LSC identities within KMT2A-rearranged AML. A, Identification of patient subgroups within 113 patients with KMT2A-rearranged AML based on differentiation state abundance. B, Distribution of KMT2A fusion partners based on KMT2A-r–early and KMT2A-r–committed subgroups. C, Relative abundance of AML differentiation states between KMT2A-r–early and KMT2A-r–committed subgroups. P values from a two-tailed Wilcoxon rank-sum test, along with the area under the receiver operating characteristic curve (AUROC), are shown for each comparison. Box plots indicate the range of the central 50% of the data with the central line marking the median. Whiskers extend from each box to 1.5× the IQR. D, Representative patient samples from the KMT2A-r–early and KMT2A-r–committed subgroups. The distribution of cell-cycle phases is also shown for each sample. E, Gene set variation analysis enrichment of primitive LSC signatures against a KMT2A-r–specific committed LSC signature, as well as E2F targets, across early and committed subgroups of KMT2A-r AML. P values from a two-tailed Wilcoxon rank-sum test are shown. Box plots indicate the range of the central 50% of the data with the central line marking the median. Whiskers extend from each box to 1.5× the IQR. F, Model for hierarchical organization of early and committed subgroups of KMT2A-r AML. Supplementary Table S1 contains the complete, unabbreviated names for each cell state. Supplementary Table S9 defines the AML differentiation states. Cell type icons are from BioRender.
Figure 7.
Figure 7.
Distinct leukemia cell hierarchies can co-exist within individual patient with AML. A, Outline of experimental workflow for identifying co-existing LSC-driven hierarchies in AML, using icons from BioRender. Briefly, the samples from patients with primary AML, CD34+CD38 fraction, and CD34CD38+ fraction were profiled by flow cytometry and scRNA-seq. PDXs from the CD34+CD38 fraction and from the CD34CD38+ fraction were also profiled by flow cytometry and scRNA-seq and the composition of their leukemia cell hierarchies is shown. B–G, Results for AML patient pt.90240. B, Immunophenotype and scRNA-seq cell state composition of primary AML. C, scRNA-seq projection results of the primary AML sample. D, Immunophenotype and scRNA-seq composition for the primary CD34+CD38 sorted fraction, representing 0.06% of primary cells. E, Immunophenotype and scRNA-seq composition for the PDX sample derived from injection of the CD34+CD38 sorted fraction, recapitulating the primary AML hierarchy. F, Immunophenotype and scRNA-seq composition for the primary CD34CD38+-sorted fraction, representing 11% of primary cells. G, Immunophenotype and scRNA-seq composition for the PDX sample derived from injection of the CD34CD38+-sorted fraction restricted to mature AML populations. H, Model depicting the co-existence of leukemia cell hierarchies within a subset of patients with AML, which could originate from intra-tumoral genetic heterogeneity. I, Schematic depicting the expansion of self-sufficient monocytic clones at relapse by acquisition of self-renewal at later stages of AML differentiation in response to novel therapies targeting primitive AML cells. Supplementary Table S1 contains the complete, unabbreviated names for each cell state. Supplementary Table S9 defines the AML differentiation states. Cell type icons are from BioRender.

Update of

Similar articles

Cited by

References

    1. Laurenti E, Göttgens B. From haematopoietic stem cells to complex differentiation landscapes. Nature 2018;553:418–26. - PMC - PubMed
    1. Miles LA, Bowman RL, Merlinsky TR, Csete IS, Ooi AT, Durruthy-Durruthy R, et al. Single-cell mutation analysis of clonal evolution in myeloid malignancies. Nature 2020;587:477–82. - PMC - PubMed
    1. Morita K, Wang F, Jahn K, Hu T, Tanaka T, Sasaki Y, et al. Clonal evolution of acute myeloid leukemia revealed by high-throughput single-cell genomics. Nat Commun 2020;11:5327. - PMC - PubMed
    1. Tothova Z, Krill-Burger JM, Popova KD, Landers CC, Sievers QL, Yudovich D, et al. Multiplex CRISPR/Cas9-based genome editing in human hematopoietic stem cells models clonal hematopoiesis and myeloid neoplasia. Cell Stem Cell 2017;21:547–55.e8. - PMC - PubMed
    1. Kurtz KJ, Conneely SE, O’Keefe M, Wohlan K, Rau RE. Murine models of acute myeloid leukemia. Front Oncol 2022;12:854973. - PMC - PubMed

MeSH terms