

Synergistic transcriptomic and metabolomic analyses in Zi geese ovaries with different clutch lengths
- PMID: 40294555
- PMCID: PMC12059380
- DOI: 10.1016/j.psj.2025.105210
Synergistic transcriptomic and metabolomic analyses in Zi geese ovaries with different clutch lengths
Abstract
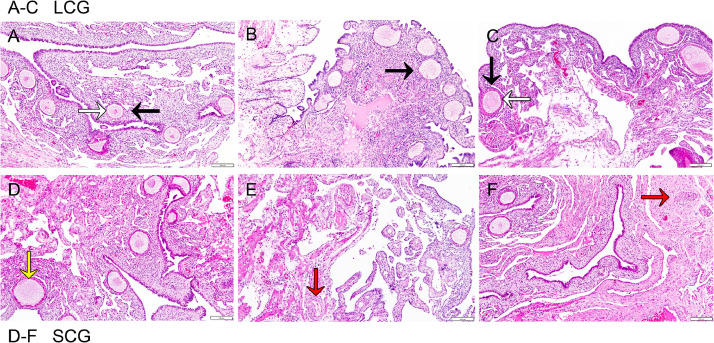
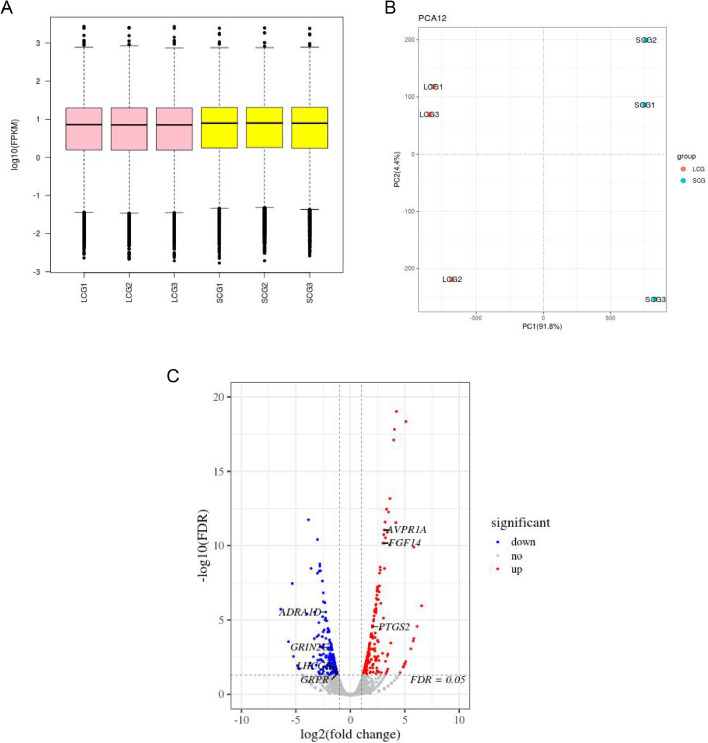
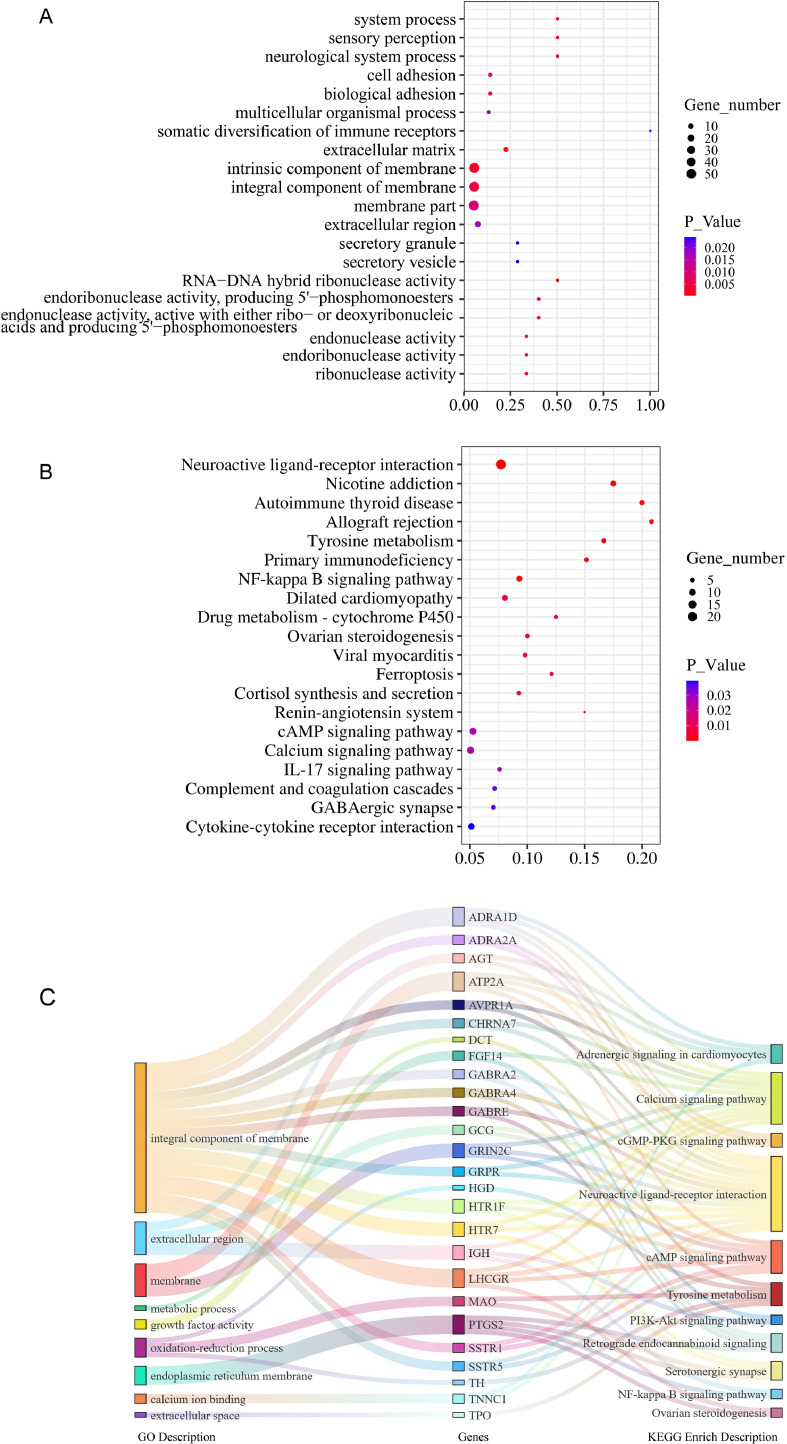
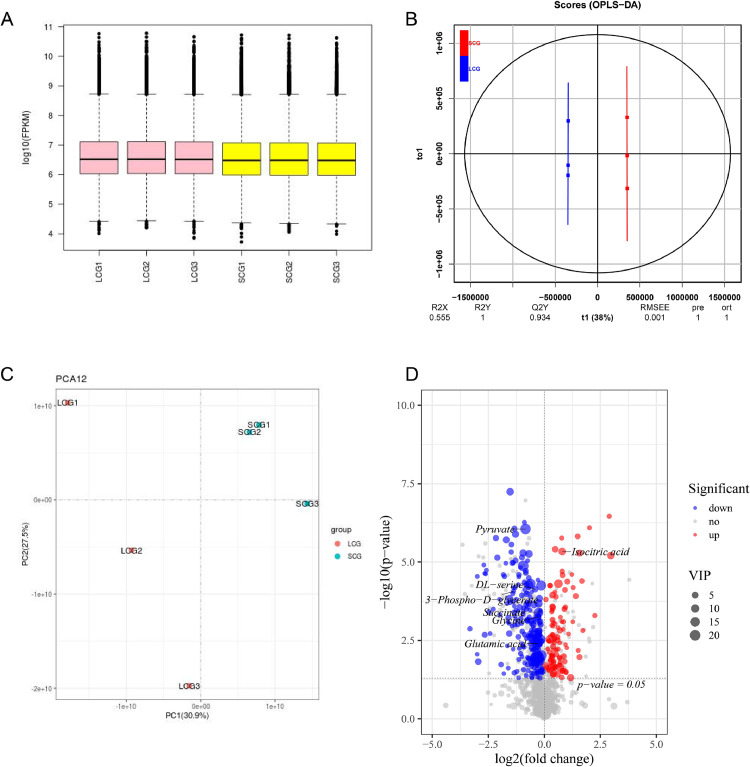
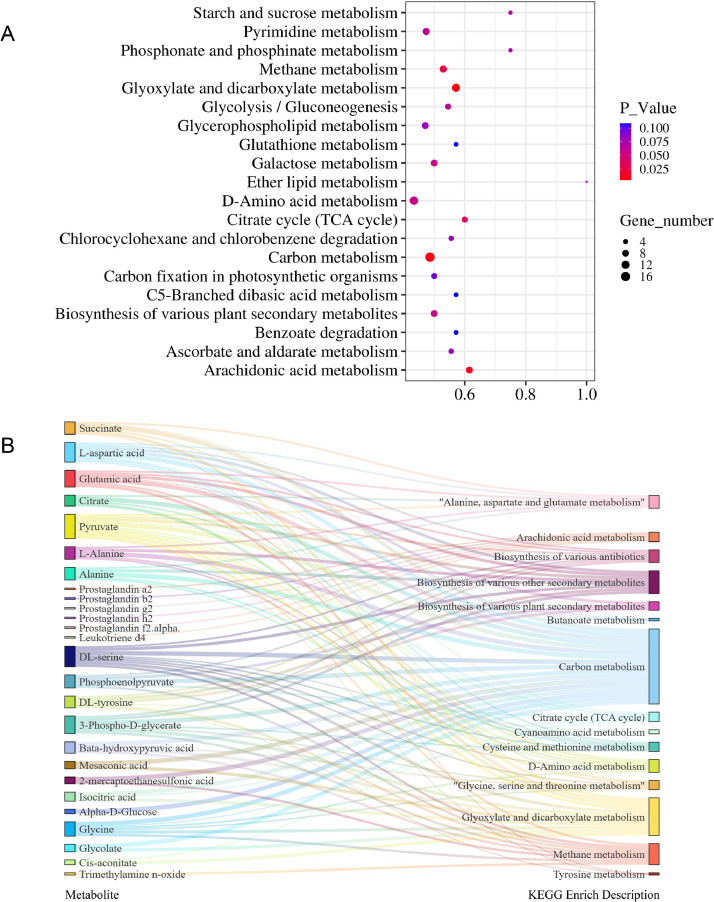
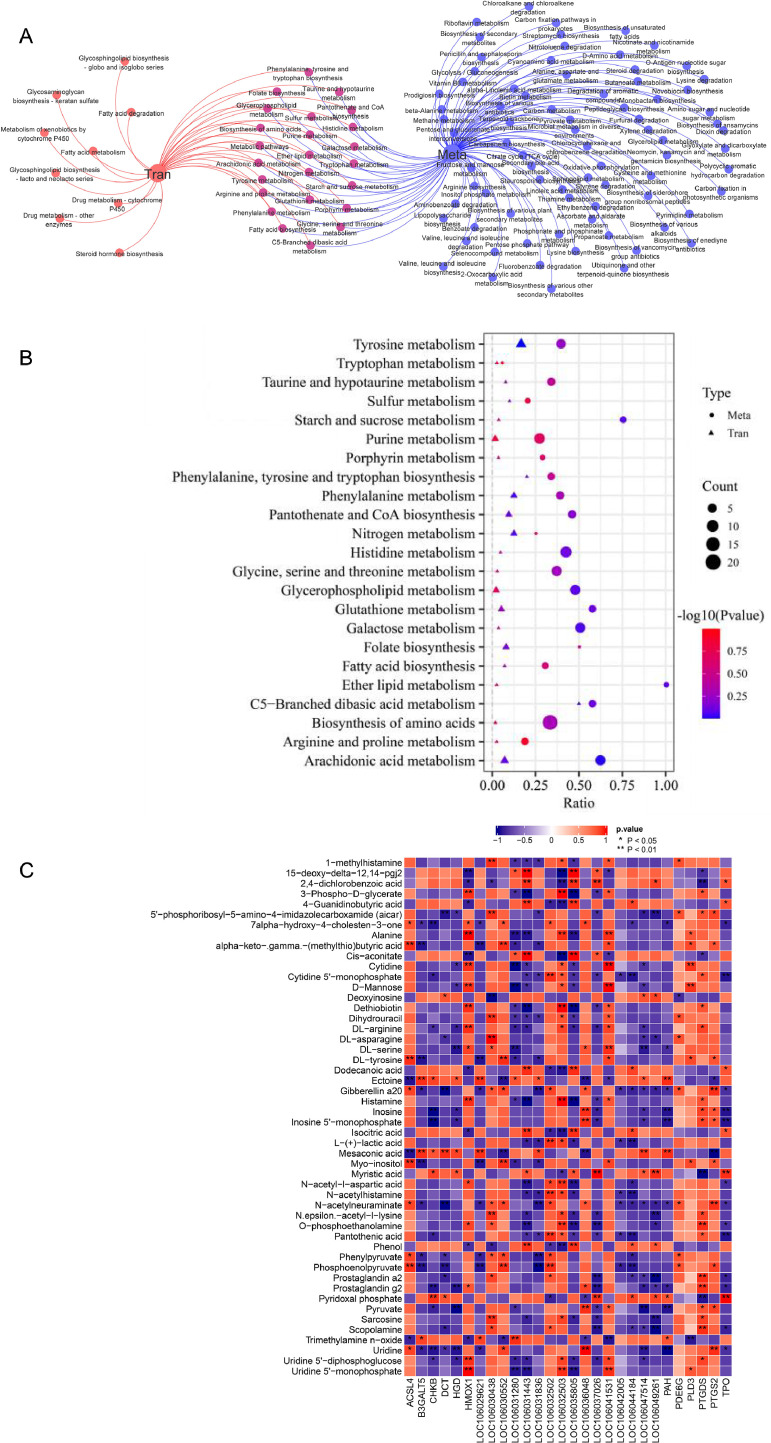
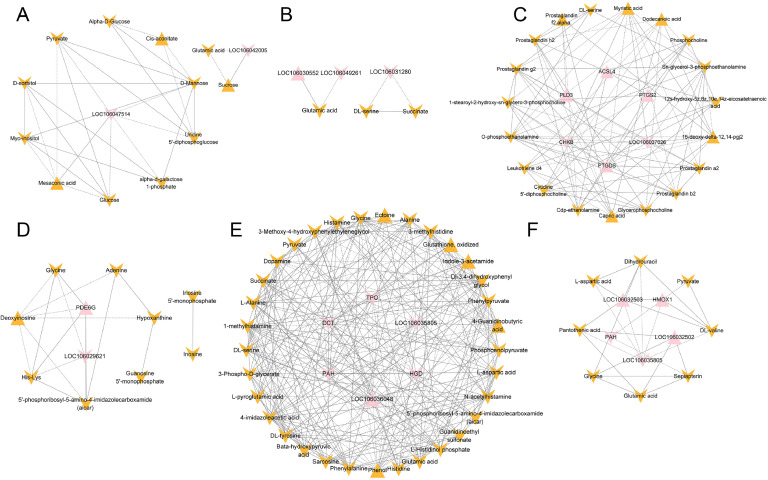
The clutch is defined as consecutive days of oviposition. Clutch length is an index that reflects ovulation persistence, and is highly correlated with egg production in birds. To identify the genetic markers associated with clutch length in geese, two consecutive experiments were conducted. In the first experiment, 200 Zi geese were selected, all 230 days old, were selected from the same batch and raised individually in the same environment. Data of egg-laying and clutch traits were recorded. After the laying period, three geese with the longest clutch lengths were selected to form the length clutch group (LCG) and three geese with the shortest clutch lengths were formed the short clutch group (SCG). In the second experiment, the ovaries of six geese were collected for transcriptomic and metabolomic analyses. The results showed that large clutch length (LCL) and average clutch length (ACL) were positively correlated with egg number (EN) (P < 0.01; r = 0.63 and 0.60, respectively). Large clutch number (LCN) was significantly correlated with the peak egg number (PEN) (r = 0.58, P < 0.01) and EN (r = 0.60, P < 0.01). EN, LCN, LCL, and ACL showed significant differences (P < 0.01) between the two clutch length groups. Transcriptomic analysis identified 424 differentially expressed genes (DEGs). Functional enrichment analysis revealed that these DEGs were mainly involved in neuroactive ligand-receptor interactions, ovarian steroidogenesis, and calcium signaling pathways. Further, AVPR1A, FGF14, and LHCGR were predicted as the key genes regulating LCL. Metabolomic analysis identified 349 differential metabolites (DMs) in both the positive and negative ion modes. Pyruvate, isocitric acid, D/L‑serine, 3-phospho-d-glycerate, succinate, glycine, and glutamic acid were identified as the key metabolites mainly enriched in the signaling pathways of the TCA cycle. Integration of transcriptomic and metabolomic data revealed critical gene-metabolite pairs, including ACSL4-phosphoenolpyruvate, implicated in LCL regulation. In summary, this study provides new insights into the genes and molecular markers affecting LCL in Zi geese.
Keywords: Metabolome; Ovary; Synergistic; Transcriptome; Zi goose.
Copyright © 2025. Published by Elsevier Inc.
Conflict of interest statement
Declaration of competing interest Conflicts of interest are not addressed in this article.
Figures
Similar articles
-
Integrated transcriptomic and metabolomic analysis of goose epididymis reveals molecular markers associated with sperm mobility.Poult Sci. 2025 Jul;104(7):105180. doi: 10.1016/j.psj.2025.105180. Epub 2025 Apr 20. Poult Sci. 2025. PMID: 40273680 Free PMC article.
-
Genetic and metabolic mechanisms underlying webbed feet pigmentation in geese: Insights from histological, transcriptomic, and metabolomic analyses.Poult Sci. 2025 Aug;104(8):105233. doi: 10.1016/j.psj.2025.105233. Epub 2025 Apr 29. Poult Sci. 2025. PMID: 40367570 Free PMC article.
-
Transcriptomic analysis to identify differentially expressed genes of abdominal fat (AF) and breast muscle (BM) tissues based on RNA-seq in Zhijin white goose.Trop Anim Health Prod. 2025 Jun 17;57(6):274. doi: 10.1007/s11250-025-04524-2. Trop Anim Health Prod. 2025. PMID: 40524054
-
A meta-analysis of genome-wide association studies to identify candidate genes associated with feed efficiency traits in pigs.J Anim Sci. 2025 Jan 4;103:skaf010. doi: 10.1093/jas/skaf010. J Anim Sci. 2025. PMID: 39847436 Free PMC article.
-
Prevalence and odds of anxiety and depression in cutaneous malignant melanoma: a proportional meta-analysis and regression.Br J Dermatol. 2024 Jun 20;191(1):24-35. doi: 10.1093/bjd/ljae011. Br J Dermatol. 2024. PMID: 38197404
References
-
- Alarcón-Granados M.C., Moreno-Ortiz H.., Rondón-Lagos M., Camargo-Villalba G.E., Forero-Castro M. Study of LHCGR gene variants in a sample of Colombian women with polycystic ovarian syndrome: a pilot study. J. King Saud Univ. Sci. 2022;34
-
- Alcantara da Silva J.V., Ispada J.., Nociti R.P., da Fonseca Junior A.M., de Lima C.B., Dos Santos E.C., Chiaratti M.R., Milazzotto M.P. The central role of pyruvate metabolism on the epigenetic maturation and transcriptional profile of bovine oocytes. Reproduction. 2024;167 - PubMed
-
- Anizoba N.W., Ikeh N..E., Ezenwosu C., Amaefule B.C., Obinna A.L., Ugwu S.O.C. Egg characteristics, blood parameters and tibia mineralization of laying hens fed varying dietary levels of limestone and periwinkle shell. Iran. J. Appl. Anim. Sci. 2024;14
-
- Aten R.F., Duarte K..M., Behrman H.R. Regulation of ovarian antioxidant vitamins, reduced glutathione, and lipid peroxidation by luteinizing hormone and prostaglandin F2α. Biol. Reprod. 1992;46:401–407. - PubMed
MeSH terms
LinkOut - more resources
Full Text Sources
Research Materials
Miscellaneous
