. 2025 May-Jun;39(3):1767-1785.
doi: 10.21873/invivo.13979.

Effect of Different Sandblasting Parameters on the Properties of Additively Manufactured and Machined Titanium Surfaces

Affiliations

Effect of Different Sandblasting Parameters on the Properties of Additively Manufactured and Machined Titanium Surfaces

Osman Akbas et al. In Vivo. 2025 May-Jun.

Abstract

Background/aim: In dentistry, the surfaces of titanium implants are often sandblasted and acid-etched in order to support successful osseointegration. The aim of this study was to investigate the impact of various sandblasting parameters on the surface roughness, contact angle and surface energy of additively manufactured (TiAl6V4) and machined commercially pure titanium (cpTi) surfaces.

Materials and methods: A total of 56 disc-shaped samples were produced using either laser powder bed fusion (TiAl6V4) or using precision cutting (cpTi). The samples were then sandblasted with different angles, distances, and pressures using an automated sandblasting machine. Afterwards, surface roughness and contact angle for water and diiodomethane were measured, and scanning electron microscopy images were taken.

Results: The results showed that the initially rough TiAl6V4 samples became smoother after sandblasting, while the smooth cpTi surfaces became rougher. Sandblasting pressure had the most significant influence on surface roughness. The surface energy of sandblasted TiAl6V4 samples showed no significant change compared to the as-built state (26.6±1.3 to 26.3±1.8 mJ/m2). In contrast, cpTi samples showed a reduction in surface energy after sandblasting (32.3±1.6 to 26.8±1.2 mJ/m2). Scanning electron microscopy revealed irregular surfaces with grooves and ridges for both types of samples. The roughness of TiAl6V4 decreased at higher sandblasting pressures, whereas cpTi surfaces became rougher.

Conclusion: Surface roughness after sandblasting is strongly influenced by the initial surface, which differs in additively manufactured TiAl6V4 samples compared to machined cpTi surfaces.

Keywords: Additive manufacturing; LPBF; TiAl6V4; commercially pure titanium; contact angle; laser powder bed fusion; osseointegration; sandblasting; sandblasting parameters; surface energy; surface roughness; titanium implants.


Conflict of interest statement

The Authors declare no conflicts of interest. The funders had no role in the design of the study; in the collection, analyses, or interpretation of data; in the writing of the manuscript; or in the decision to publish the results.

Figures

Figure 1
Figure 1
(A) Machined titanium rod (cpTi) specimens, stored in well plates. (B) Built plate with the additively manufactured (TiAl6V4) specimens.
Figure 2
Figure 2
(A) Sandblasting machine used in the study. (B) Schematic cross-sectional view of the sandblasting chamber.
Figure 3
Figure 3
Schematic representation of (A) a spacer with a blasting distance of 15 mm at 45° (trajectory indicated with a green line), (B) sandblasting path (indicated with red lines) and profilometry path (indicated with blue lines), and (C) positions of the drops for the contact angle measurement.
Figure 4
Figure 4
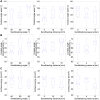
Boxplots illustrating the main effects of sandblasting on the roughness of additively manufactured TiAl6V4 samples (PGN 1-27). (A) Results according to sandblasting angle. (B) Results according to sandblasting distance. (C) Results according to sandblasting pressure. The red line represents the median. The boxes represent the 25th to 75th percentile. The black whiskers extend to the minimum and maximum values.
Figure 5
Figure 5
Scanning electron microscopy images of the TiAl6V4 surface in (A) the as-built state (PGN 28) and (B) after sandblasting (PGN 1).
Figure 6
Figure 6
Scanning electron microscopy images of the TiAl6V4 surface after treatment with different combinations of sandblasting parameters. To reduce the number of images, combinations with a distance of 10 mm and an angle of 60° are not shown.
Figure 7
Figure 7
Boxplots illustrating the main effects on the contact angle and surface energy of additively manufactured TiAl6V4 samples (PGN 1-27). (A) Contact angles for water. (B) Contact angles for diiodomethane. (C) Surface energy. The red line represents the median. The boxes represent the 25th to 75th percentile. The black whiskers extend to the minimum and maximum values.
Figure 8
Figure 8
Owens, Wendt, Rabel and Kaelble plot for the additively manufactured TiAl6V4 samples. The green line represents the regression line for the surface in the as-built state (PGN 28). The red line is the regression line for the mean value of all sandblasted samples (PGN 1-27). The blue area is where all sandblasted regression lines are located.
Figure 9
Figure 9
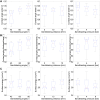
Boxplots illustrating the main effects on the roughness of machined titanium rod (cpTi) samples (PGN 29-55). (A) Results for varied sandblasting angle. (B) Results for varied sandblasting distance. (C) Results for varied sandblasting pressure. The red line represents the median. The boxes represent the 25th to 75th percentile. The black whiskers extend to the minimum and maximum values.
Figure 10
Figure 10
Scanning electron microscopy images of the cpTi surface in (A) the as-cut state (PGN 56) and (B) after sandblasting (PGN 37).
Figure 11
Figure 11
Scanning electron microscopy images of the cpTi surface with different combinations of sandblasting parameters. To reduce the number of images, combinations with a distance of 10 mm and an angle of 60° are not shown.
Figure 12
Figure 12
Boxplots illustrating the main effects on the contact angle and surface energy of machined titanium rod (cpTi) samples (PGN 29-55). (A) contact angles for water (B) contact angles for diiodomethane (C) Surface energy. The red line represents the median. The boxes represent the 25th to 75th percentile. The black whiskers extend to the minimum and maximum values.
Figure 13
Figure 13
Owens, Wendt, Rabel and Kaelble plot for the machined titanium rod (cpTi) samples. The green line represents the regression line for the surface in the as-cut state (PGN 56). The red line is the regression line for the mean value of all sandblasted samples (PGN 29-55). The blue area is where all sandblasted regression lines are located.

References

    1. Wong KV, Hernandez A. A review of additive manufacturing. Int Sch Res Notices. 2012;2012:1–10. doi: 10.5402/2012/208760. - DOI
    1. Jiménez M, Romero L, Domínguez IA, Espinosa MDM, Domínguez M. Additive manufacturing technologies: an overview about 3D printing methods and future prospects. Complexity. 2019;2019(1):1–30. doi: 10.1155/2019/9656938. - DOI
    1. Ngo TD, Kashani A, Imbalzano G, Nguyen KT, Hui D. Additive manufacturing (3D printing): A review of materials, methods, applications and challenges. Composites Part B-Engineering. 2018;143:172–196. doi: 10.1016/j.compositesb.2018.02.012. - DOI
    1. Moiduddin K, Darwish S, Al-Ahmari A, Elwatidy S, Mohammad A, Ameen W. Structural and mechanical characterization of custom design cranial implant created using additive manufacturing. Electron J Biotechnol. 2017;29:22–31. doi: 10.1016/j.ejbt.2017.06.005. - DOI
    1. Zadpoor AA. Design for additive bio-manufacturing: from patient-specific medical devices to rationally designed meta-biomaterials. Int J Mol Sci. 2017;18(8):1607. doi: 10.3390/ijms18081607. - DOI - PMC - PubMed

LinkOut - more resources