. 2025 Apr 28;16(1):3967.
doi: 10.1038/s41467-025-59186-3.

Epigenetic silencing of DNA sensing pathway by FOXM1 blocks stress ligand-dependent antitumor immunity and immune memory

Affiliations

Epigenetic silencing of DNA sensing pathway by FOXM1 blocks stress ligand-dependent antitumor immunity and immune memory

Santosh Timilsina et al. Nat Commun. .

Abstract

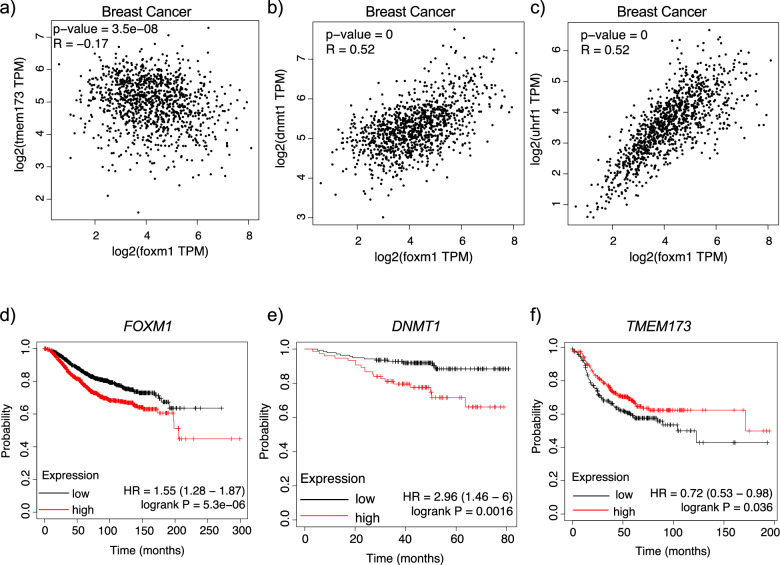
The interplay between tumor cells and the microenvironment significantly influences cancer progression. Here, we report a significant role of the transcription factor FOXM1 in shaping the tumor immune landscape. Single-cell sequencing reveals that tumor-intrinsic FOXM1 creates an immune-suppressive tumor microenvironment by inhibiting expression of stress ligands (including ULBP1) on cancer cells, thereby blocking NKG2D-NKG2DL interactions critical for priming natural killer- and T cell-mediated cytotoxicity of cancer cells. FOXM1 suppresses ULBP1 expression by epigenetically silencing the DNA-sensing protein STING using a DNMT1-UHRF1 complex, which in turn inhibits the unfolded protein response protein CHOP from activating ULBP1. Importantly, cancer patients with higher levels of FOXM1 and DNMT1, and lower levels of STING and ULBP1, have worse survival and are less responsive to immunotherapy. Collectively, our findings provide key insight into how a tumor-intrinsic transcription factor epigenetically shapes the tumor immune microenvironment, with strong implications for refining existing and designing new cancer immunotherapies.


Conflict of interest statement

Competing interests: The authors declare no competing interests.

Figures

Fig. 1
Fig. 1. Foxm1 depletion inhibits long-term tumor growth in the presence of intact immunity.
a, b Representative Western blot of human FOXM1 levels in control and FOXM1 knockout MDA-MB-231 (a) or E0771 (b) cells using two different sgRNAs (sgRNA 1 and sgRNA 3). The blots are representative of three independent experiments. c Control and FOXM1 knockout MDA-MB-231 cells were plated at low density; then, cell growth/confluency measurements were performed using Incucyte assays. Results are shown as % cell confluency. d Control and Foxm1 knockout E0771 cells were plated at low density, and cell confluency measured using Incucyte assays. Results are shown as % cell confluence. Figures (c) and (d) are derived from three biological replicates, with each replicate containing two technical replicates. e Tumor volumes in NOD-scid-gamma (NSG) immunodeficient mice orthotopically implanted with scrambled control (Ctrl) or Foxm1 knockout (sgRNA 1 and sgRNA 3) E0771 cells (n = 7 mice/group). f Left: Tumor volumes in C57BL6/J immunocompetent mice orthotopically implanted with scrambled control (Ctrl) or Foxm1 knockout (sgRNA 1 and sgRNA 3) E0771 cells (n = 8 mice/group). Right: Tumor weights in scrambled control (Ctrl) and knockout (sg1 and Sg3) groups. g Left: Schema (Created in BioRender. Nirzhor, S. (2025) https://BioRender.com/s8dko5w) for rechallenge experiments to test immune memory in C57BL6/J mice implanted with scrambled control (n = 5) and Foxm1 knockout E0771 cells (n = 5). Right: Mice in the Foxm1 knockout sg3 group (n = 4) that did not form tumors were rechallenged with low passage scrambled control (Ctrl) E0771 cells at the original tumor inoculation site at day 65. Tumor volume for all experiments was calculated using V = [l x (w)2]/2. Control groups in all graphs are represented by dark blue circles, while FOXM1 knockout sg1 and sg3 groups are represented by red square or triangle, respectively. Results are displayed as mean +/− SEM. p-values for panels (cf) (left side) were calculated using non-linear regression with Gompertz growth for panel (c, d) or Malthusian growth for panel (e, f). p-values for the panel f (right side) were calculated using Welch’s two-tailed t test. Source data are provided as a Source Data file.
Fig. 2
Fig. 2. FOXM1 blocks infiltration of immune cells.
ad Representative results from flow cytometry analyses of infiltrated immune cells in tumors from scrambled control (Ctrl; n = 3) and Foxm1 knockout (Foxm1 KO; n = 3) groups. Data are presented as mean values +/- SEM. Representative gates for each group are shown directly below the graphs. e Left: Representative results from flow cytometry analyses of infiltrated myeloid/antigen presenting cell populations in scrambled control (Ctrl; n = 4) and Foxm1 KO (n = 4) tumors. Data are presented as mean values +/− SEM. % Total on the y axis represents % of total living single cells. Right: Representative gates for each myeloid population of cells. p-values for panels (ad) were calculated using two-sided Welch’s t tests, while p- values for panel (e) was calculated using multiple t test with Benjamini, Krieger, and Yekutieli correction. Control and Foxm1 knockout groups in all bar graphs are represented by dark blue circles or red squares, respectively. Source data are provided as a Source Data file.
Fig. 3
Fig. 3. Single-cell transcriptome analyses of tumor and immune cells from scrambled and Foxm1 KO groups.
a UMAP representation of 16,552 single cells from scrambled control (6732 cells) and Foxm1 KO (sg1: 4673 and sg3: 5147 cells) samples (n = 5) showing proportions of cell types in the tumor microenvironment. Tumor samples were pooled separately from control and Foxm1 knockout groups for single-cell sequencing. Cell type compositions are shown as cluster numbers (left), samples (middle), and cell type annotation assignments based on marker expression (also see Supp. Data File 1) (right). b Stacked bar plots showing the number of cells in each cell population of scrambled control (Ctrl) and Foxm1 KO (sg1 and sg3) tumors. c Pie chart showing the proportions of different cell populations in scrambled control (Ctrl) and Foxm1 KO (sg1 and sg3) tumors. d UMAP representation of 4483 T and NK cells from control (812 cells) and Foxm1 KO (sg1: 1560 and sg3: 2111) samples (n = 5) showing subpopulations of T and NK cells based on established markers (also see Supp. Data File 2). e T and NK cell subpopulations in scrambled control (Ctrl) and Foxm1 KO (sg1 and sg3) tumors. f Top enriched pathways (GSEA) in T and NK cells from control (Ctrl) and Foxm1 KO (sg1 and sg3) tumors. Normalized enrichment scores (NES) are shown below. g Inflammatory and activation markers in T and NK cells in (ctrl) and Foxm1 KO (sg1 and sg3) tumors. The percent of positive cells is indicated by the size of the dot, and the scaled expression level is indicated by the color. Source data are provided as a Source Data file.
Fig. 4
Fig. 4. Foxm1 depletion results in enhanced tumor-immune cell communication, resulting in tumor suppression through activation of CD8 + T and NK cells.
a Cellchat network showing the probability and patterns of communications between different cell populations in (ctrl) and Foxm1 KO (sg1 and sg3) tumors. The cellchat network was constructed using CellPhoneDB. Line thicknesses reflect the number of ligand-receptor interactions between different cell populations; circle sizes indicate which cells are contributing to cell-to-cell communication. b Interactions between ligands and receptors expressed on tumor and immune cells in scrambled (ctrl) and Foxm1 KO (sg1 and sg3) tumors. Line thicknesses indicate the intensity of interactions. Highly enriched pathways, including cell death signaling (FAS, TRAIL), antigen presentation (MHC-I), and NK cell activation (NKG2DL) in Foxm1 KO compared to control are shown. c Immunofluorescent staining of ULBP1 in E0771 Ctrl and Foxm1 KO xenograft sections. ULBP1:green; DAPI:blue. Scale bar = 20 μm. White arrows indicate ULBP1 localization. Images are representative of three independent biological replicates per group. d qRT-PCR analysis of ULBP1 in E0771 control and Foxm1 KO cells (n = 3 biological replicates /group). e Schematic (Created in BioRender. Nirzhor, S. (2025) https://BioRender.com/uws6f4d) showing injection schedule of antibodies to deplete CD8 or NK1.1 or block NKG2D. f Left: Tumor growth in Rag1 -/- mice and CD8 + T cell-depleted and IgG-control treated mice transplanted with Foxm1 KO (sg3) E0771 cells. Rag -/- (n = 3); IgG Isotype control and CD8 T depleted (n = 4). Right: Tumor growth in IgG isotype control, NK cell-depleted, and NKG2D cell-depleted mice transplanted with Foxm1 KO (sg3) E0771 cells(n = 4/group). g Differentially secreted factors in media collected from scrambled control (Ctrl) and Foxm1 knockout E0771 cells. Left: Red box indicates altered cytokines (CCL2/MCP-1 and CCL5/RANTES) in Foxm1 KO compared to Ctrl. Right: Quantification of bands shown in red box, normalized to negative control. Results are mean +/− SEM of three pooled biological replicates. p-value for panel (d and f) was calculated using two-sided Welch’s t test or non-linear regression with Malthusian growth, while for panel (g), multiple t test with Benjamini, Krieger, and Yekutieli correction was used. Control and Foxm1 KO groups in all bar graphs are represented by dark blue circles or red squares, respectively. Source data are provided as a Source Data file.
Fig. 5
Fig. 5. FOXM1 assembles an epigenetic repressor complex to inhibit STING and consequently unfolded protein response pathways to control stress ligand ULBP1 expression in cancer cells.
a Heatmap showing the log-normalized expression of top genes from GSEA pathway enrichment analysis. Genes representing pathways with the highest enrichment in E0771 Foxm1 knockout tumors compared to scrambled control are shown. b Western blots of cGas-STING pathway proteins in scrambled (Ctrl) and FOXM1 knockout E0771 (left) and MDA-MB-231 cells (right). β-actin or GAPDH was used as a loading control. The arrow indicates the band for total STING. c, d qRT-PCR analysis of STING (c), and DNMT1 and UHRF1 mRNA (d) in MDA-MB-231 Ctrl and FOXM1 KO cells. e Western blot analysis of DNMT1 and UHRF1 in MDA-MB-231 and E0771 Ctrl and FOXM1 KO cells. f ChIP-qPCR in MDA-MB-231 cells showing FOXM1 enrichment on the DNMT1 promoter. g Western blot analysis of MDA-MB-231 and BT549 cells treated with DNMT1 inhibitor (GSK-3484862) using antibody against STING. h Western blot analysis of MDA-MB-231 transfected with scrambled (siCtrl) or siDNMT1 cells using antibodies against cGas-STING pathway proteins. i ChIP-qPCR in MDA-MB-231 cells showing DNMT1 enrichment on STING promoter. j ChIP-qPCR in MDA-MB-231 Ctrl and FOXM1 KO cells showing enrichment of H3K4me3 on STING promoter. k MethyLight qRT-PCR assay using primers spanning STING promoter in Ctrl and FOXM1 KO MDA-MB-231 cells. The bar graph shows the relative log2 of percentage STING promoter methylation in FOXM1 wild-type and FOXM1 knockout groups. l Western blot analyses in scrambled and Foxm1 KO E0771 cells using antibodies against the indicated UPR proteins. m qRT-PCR on Foxm1 KO cells transfected with scrambled or Sting siRNA using primers against MHC-I, IFNβ, and ULBP1. All bar graphs represent log2 of fold change in gene expression or fold enrichment on promoters. All qPCR data represent the mean +/− SEM of three biological replicates with two technical replicates per group. Western blots are representative of three independent experiments. p-values for panels (c, f, ik) were calculated using a two-sided Welch’s t test. p-values for (d and m) were calculated using multiple t test with Benjamini, Krieger, and Yekutieli correction. Control and FOXM1 knockout groups in all bar graphs are represented by dark blue circles or red squares, respectively. Source data are provided as a Source Data file.
Fig. 6
Fig. 6. High FOXM1 expression is correlated with decreased immune cell infiltration.
a (top) Immunofluorescent staining of FOXM1, CD3 + CD8 + T cells, and CD56 + NK cells in tumor tissues from breast cancer patients based on levels of high versus low FOXM1 expression. Top images: FOXM1 indicated by red; CD56 indicated by green. Bottom images: CD3 is indicated by red; CD8 is green (bottom image). DAPI is stained as blue. The circle indicates a cluster of NK cells in a FOXM1 low patient. (bottom) ULBP1 staining in tissues from breast cancer patients based on levels of high versus low FOXM1 expression. Scale bar indicates 50μm. The experiment was performed with n = 3 patients for each group (FOXM1 high and FOXM1 low). Representative pictures from two patients per group are shown. The number shown on the top of the figure indicates de-identified breast cancer patients. bd Spearman correlations of FOXM1 RNA levels with tumor purity and immune cell infiltration in breast cancer patients from the TIMER2.0 database. The populations of cells examined include cytotoxic cells (NK cells, CD8 + T cells) and immunosuppressive cells (regulatory T cells [Tregs] and myeloid-derived suppressive cells [MDSC]. p-values for panels b-d were calculated by the TIMER2.0 database using the Spearman correlation coefficient.
Fig. 7
Fig. 7. Clinical relevance of FOXM1-DNMT1-STING axis to breast cancer patient survival and response to immunotherapy.
ac Pearson correlation analyses between FOXM1 and various genes, including STING, DNMT1, and UHRF1, in breast cancer patients (n = 1085) from the GEPIA2 database. df Kaplan-Meier survival analysis showing associations between FOXM1, DNMT1, and STING (TMEM173) expression and overall survival (FOXM1 and DNMT1) or relapse-free survival (STING). (d) n = 942 patients for FOXM1 low and n = 937 patients for FOXM1 high; (e) n = 236 patients for STING low and n = 234 patients for STING high; (f) n = 139 patients for DNMT1 low and n = 75 patients for DNMT1 high;values for panels (ac) were calculated by GEPIA2 using Pearson correlation coefficient and a two-tailed t distribution.
Fig. 8
Fig. 8. Proposed mechanism of how tumor-intrinsic FOXM1 shapes the tumor microenvironment in cancers.
We propose that high levels of FOXM1 expression in cancer cells create an immunosuppressive microenvironment by promoting epigenetic silencing of the DNA-sensing protein STING, leading to reduced expression of stress ligands, MHC-1 class genes, and pro-inflammatory molecules. FOXM1 depletion leads to STING activation through several mechanisms. First, FOXM1 depletion leads to marked reductions in DNMT1 and UHRF1, constituting an epigenetic repressor complex targeted to the STING promoter. Second, FOXM1 depletion leads to an increase in micronuclei, likely through increased DNA damage or lapses in cell cycle, and consequently activation of the cytosolic DNA sensing cGas-STING-NFkB and unfolded protein response (UPR) pathways. Activation of STING-NFκB signaling induces expression of chemokines/cytokines such as CCL5, which in turn promotes recruitment of immune cells to the tumor. In addition, activation of STING-UPR stimulates expression of MHC1 and the stress ligand ULBP1, which facilitates interaction and activation of NKG2D-expressing CD8 + T and NK cells and subsequent killing of cancer cells. The model was created in BioRender. Nirzhor, S. (2025) https://BioRender.com/v49t420.

References

    1. Wellenstein, M. D. & Visser, K. E. Cancer-cell-intrinsic mechanisms shaping the tumor immune landscape. Immunity48, 399–416 (2018). - PubMed
    1. Gonzalez, H., Hagerling, C. & Werb, Z. Roles of the immune system in cancer: from tumor initiation to metastatic progression. Genes Dev.32, 1267–1284 (2018). - PMC - PubMed
    1. Spranger, S. & Gajewski, T. F. Mechanisms of tumor cell–intrinsic immune evasion. Annu. Rev. Cancer Biol.2, 213–228 (2018).
    1. Li, J. et al. Tumor cell-intrinsic factors underlie heterogeneity of immune cell infiltration and response to immunotherapy. Immunity49, 178–193.e7 (2018). - PMC - PubMed
    1. Nguyen, K. B. & Spranger, S. Modulation of the immune microenvironment by tumor-intrinsic oncogenic signaling. J. Cell Biol.219, e201908224 (2020). - PMC - PubMed

MeSH terms