. 2025 Apr 28;16(1):3765.
doi: 10.1038/s41467-025-58149-y.

Dissecting cross-population polygenic heterogeneity across respiratory and cardiometabolic diseases

Collaborators, Affiliations

Dissecting cross-population polygenic heterogeneity across respiratory and cardiometabolic diseases

Yuji Yamamoto et al. Nat Commun. .

Abstract

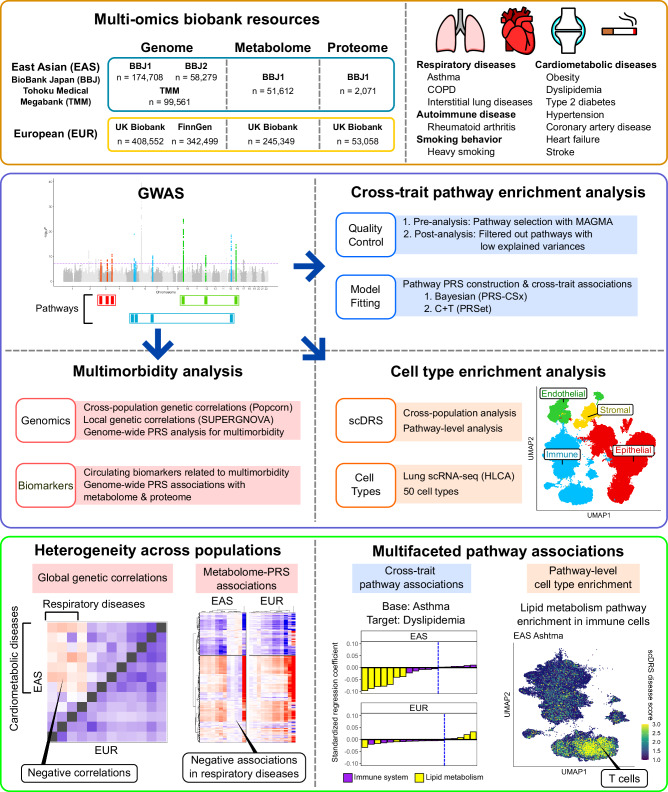
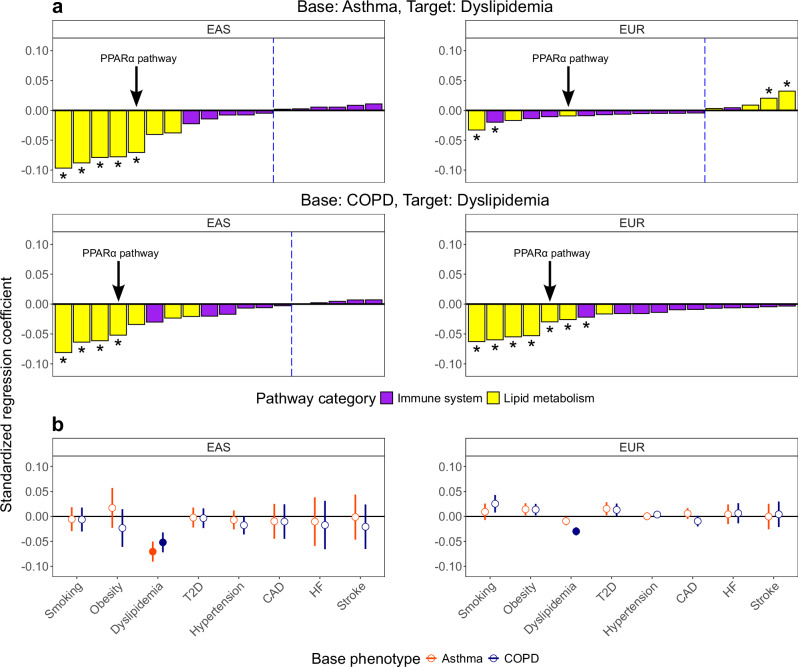
Biological mechanisms underlying multimorbidity remain elusive. To dissect the polygenic heterogeneity of multimorbidity in twelve complex traits across populations, we leveraged biobank resources of genome-wide association studies (GWAS) for 232,987 East Asian individuals (the 1st and 2nd cohorts of BioBank Japan) and 751,051 European individuals (UK Biobank and FinnGen). Cross-trait analyses of respiratory and cardiometabolic diseases, rheumatoid arthritis, and smoking identified negative genetic correlations between respiratory and cardiometabolic diseases in East Asian individuals, opposite from the positive associations in European individuals. Associating genome-wide polygenic risk scores (PRS) with 325 blood metabolome and 2917 proteome biomarkers supported the negative cross-trait genetic correlations in East Asian individuals. Bayesian pathway PRS analysis revealed a negative association between asthma and dyslipidemia in a gene set of peroxisome proliferator-activated receptors. The pathway suggested heterogeneity of cell type specificity in the enrichment analysis of the lung single-cell RNA-sequencing dataset. Our study highlights the heterogeneous pleiotropy of immunometabolic dysfunction in multimorbidity.


Conflict of interest statement

Competing interests: The authors declare no competing interests.

Figures

Fig. 1
Fig. 1. The study overview.
We performed a GWAS meta-analysis on twelve complex traits examining 232,987 East Asian individuals (EAS) from BioBank Japan (BBJ) and 751,051 European individuals (EUR) from UK Biobank and FinnGen. We estimated the heritability and genetic correlations among the complex traits and found significant negative genetic correlations between respiratory and cardiometabolic diseases in BBJ (bottom left corner). Association analyses for genome-wide polygenic risk scores (PRS) and nuclear magnetic resonance (NMR) metabolite and Olink protein biomarkers showed the negative associations between regression coefficients for dyslipidemia and respiratory diseases (bottom left). Cross-trait pathway association analysis using Bayesian pathway PRS detected five pathways with negative risk associations, the functions of which regulate lipid metabolism (bottom right). Further pathway enrichment analysis of cell types demonstrated the enrichment of the lipid pathway in T cells of asthma (bottom right corner).
Fig. 2
Fig. 2. Analysis of heritability, genetic correlations, and phenotypic correlations in EAS and EUR populations.
a A bar plot of the heritability for twelve complex traits in EAS and EUR populations. Trait labels are colored based on the disease categories. b A heatmap of genetic correlations in the twelve complex traits colored by LDSC genetic correlation estimates. P-values of the two-sided tests are adjusted using Bonferroni corrections. The upper and lower triangular matrices show EAS and EUR analyses, respectively. c A heatmap illustrating the phenotypic correlations in the twelve complex traits colored by the natural logarithm of odds ratio (OR). P-values are calculated from two-sided Fisher’s exact tests and adjusted using Bonferroni corrections. EUR populations included UKB samples. OR was calculated via Fisher’s exact tests. h2: heritability. *: Puncorrected < 0.05/66. CAD: coronary artery disease; COPD: chronic obstructive pulmonary disease; HF: heart failure; ILD: interstitial lung disease; RA: rheumatoid arthritis; and T2D: type 2 diabetes.
Fig. 3
Fig. 3. Predictive performance and cross-trait associations of genome-wide PRS.
a Results from logistic regression analyses testing the associations between target phenotypes in testing datasets and genome-wide PRS calculated from the training datasets using PRS-CSx. The analyses used identical phenotypes in the training and testing datasets. In the forest plots, dots indicate standardized regression coefficients, and whiskers represent 95% confidence intervals. Disease labels are colored based on the disease categories. b Results from logistic regression analyses testing the cross-trait associations of base and target phenotypes. After excluding all individuals with overlapping base and target phenotypes from the testing datasets, we analyzed the associations between the target phenotype and the PRS generated from the training datasets. The heatmaps are colored based on standardized regression coefficients. P-values of the two-sided tests are adjusted using Bonferroni corrections. *: Puncorrected < 0.05/132. CAD: coronary artery disease; COPD: chronic obstructive pulmonary disease; HF: heart failure; ILD: interstitial lung disease; RA: rheumatoid arthritis; and T2D: type 2 diabetes.
Fig. 4
Fig. 4. Results from genome-wide PRS association analysis for circulating NMR lipid and metabolite markers.
We assessed the associations between genome-wide PRS and NMR metabolome, adjusting for age, sex, and the top ten genetic PCs. Heatmaps are colored based on standardized regression coefficients (β) calculated from 325 biomarkers and genome-wide PRS association analysis. We categorized circulating lipid and metabolite markers based on the classification defined in ukbnmr R package, a toolkit for quality control and removing technical variation for NMR metabolome data. As positive controls for the analysis, we found positive correlations of dyslipidemia PRS with VLDL-C-related markers and negative ones with HDL-C-related markers in both populations. CAD: coronary artery disease; COPD: chronic obstructive pulmonary disease; HF: heart failure; ILD: interstitial lung disease; RA: rheumatoid arthritis; and T2D: type 2 diabetes.
Fig. 5
Fig. 5. Association analyses of immune and lipid metabolism pathways in asthma and COPD.
a Results from logistic regression analyses investigating the pathway associations of dyslipidemia with asthma and COPD. P-values of the two-sided tests are adjusted using Bonferroni corrections. For the phenotype pairs of dyslipidemia−asthma and dyslipidemia−COPD, we analyzed all 18 pathways with significant associations in MAGMA gene-set analysis. The bar plots provide standardized regression coefficients of the analyzed pathways. Arrows on the bar plots pointed PPARα pathway. *: Puncorrected < 0.05/2,376. b Forest plots of logistic regression analyses that assess the pathway regulating the lipid metabolism by PPARα. For pathways regulating lipid metabolism by PPARα, we analyzed cross-trait associations of asthma and COPD with other phenotypes. We generated pathway PRS of asthma and COPD from the training datasets to test the associations with target phenotypes in the testing datasets. In the forest plots, dots indicate standardized regression coefficients, and whiskers represent 95% confidence intervals. P-values of the two-sided tests are adjusted using Bonferroni corrections. ●: Puncorrected < 0.05/2376; ○: Puncorrected ≥ 0.05/2376.
Fig. 6
Fig. 6. Overview of cross-population cell type enrichment analyses.
Disease associations of and the mean differences in scDRS disease scores at the human lung cell type level. To investigate the disease-associated cell types, we analyzed a scRNA-seq dataset with 50 cell types obtained from the lungs. We applied scDRS with the default settings to calculate disease scores for the twelve complex traits using the GWAS summary statistics and to perform downstream analysis. The left and middle heatmaps show the cell type enrichment in EAS and EUR populations, respectively. Each tile in the left and middle heatmaps is colored based on the proportion of significant cells in the tested cell type. The right heatmap is colored based on the mean differences in scDRS disease scores between EAS and EUR populations. □: FDR < 0.05; ×: FDR of heterogeneity <0.05; +: FDR of t-tests assessing the significance of the scDRS disease score differences across all pairs of the cell types and phenotypes.
Fig. 7
Fig. 7. Cell types with different enrichment between EAS and EUR populations.
a A UMAP plot of the scRNA-seq dataset from the Human Lung Cell Atlas colored by coarsest annotations. b Mean differences in scDRS disease scores of population-specific cell types. From all phenotype-cell type pairs identified as significant in EAS or EUR cell type enrichment analysis, the plots described the pairs with prominent differences in the mean scDRS disease scores between EAS and EUR populations. The bar plots provide the differences in disease scores of EAS and EUR populations. c UMAP plots of fibroblasts colored by the enrichment in COPD. The leftmost UMAP plot is colored based on the class of tested cell types. The two UMAP plots in the middle are colored based on the disease scores for EAS (left) and EUR (right) populations. The rightmost UMAP plot is colored based on the differences in disease scores between EAS and EUR populations. d UMAP plots of goblet cells colored by the enrichment in ILD. e UMAP plots of B cells colored by the enrichment in asthma.
Fig. 8
Fig. 8. PPARα pathway enrichment analysis of immune cells for asthma and dyslipidemia.
a MAGMA gene analysis targeting the pathway regulating the lipid metabolism by PPARα. We plotted the logarithm of uncorrected P-values obtained from the gene analysis of asthma and dyslipidemia in EAS and EUR populations. The plots label the top five significant genes in EAS or EUR populations. P-values of the one-sided tests are adjusted using Bonferroni corrections. The corrected significance thresholds are shown as purple dashed lines. b Coarse annotations of immune cells in the lung tissue. c Enrichment analyses of the PPARα pathway in asthma. After selecting gene-level Z-scores included in the PPARα pathway, we calculated the pathway-level disease scores for eight cell types using scDRS. The UMAP plots are colored based on the disease scores of the PPARα pathway. d Enrichment analyses of the PPARα pathway in dyslipidemia.

References

    1. Skou, S. T. et al. Multimorbidity. Nat. Rev. Dis. Prim.8, 48 (2022). - PMC - PubMed
    1. Chowdhury, S. R., Chandra Das, D., Sunna, T. C., Beyene, J. & Hossain, A. Global and regional prevalence of multimorbidity in the adult population in community settings: a systematic review and meta-analysis. eClinicalMedicine57, 101860 (2023). - PMC - PubMed
    1. Di Angelantonio, E. et al. Association of cardiometabolic multimorbidity with mortality. JAMA314, 52 (2015). - PMC - PubMed
    1. Mannino, D. M. et al. Economic burden of COPD in the presence of comorbidities. Chest148, 138–150 (2015). - PMC - PubMed
    1. Jindai, K., Nielson, C. M., Vorderstrasse, B. A. & Quiñones, A. R. Multimorbidity and functional limitations among adults 65 or older, NHANES 2005–2012. Prev. Chronic Dis.13, 160174 (2016). - PMC - PubMed

MeSH terms

LinkOut - more resources