. 2025 Apr 28;16(1):3870.
doi: 10.1038/s41467-025-58436-8.

Angiogenic and immune predictors of neoadjuvant axitinib response in renal cell carcinoma with venous tumour thrombus

Collaborators, Affiliations

Angiogenic and immune predictors of neoadjuvant axitinib response in renal cell carcinoma with venous tumour thrombus

Rebecca Wray et al. Nat Commun. .

Abstract

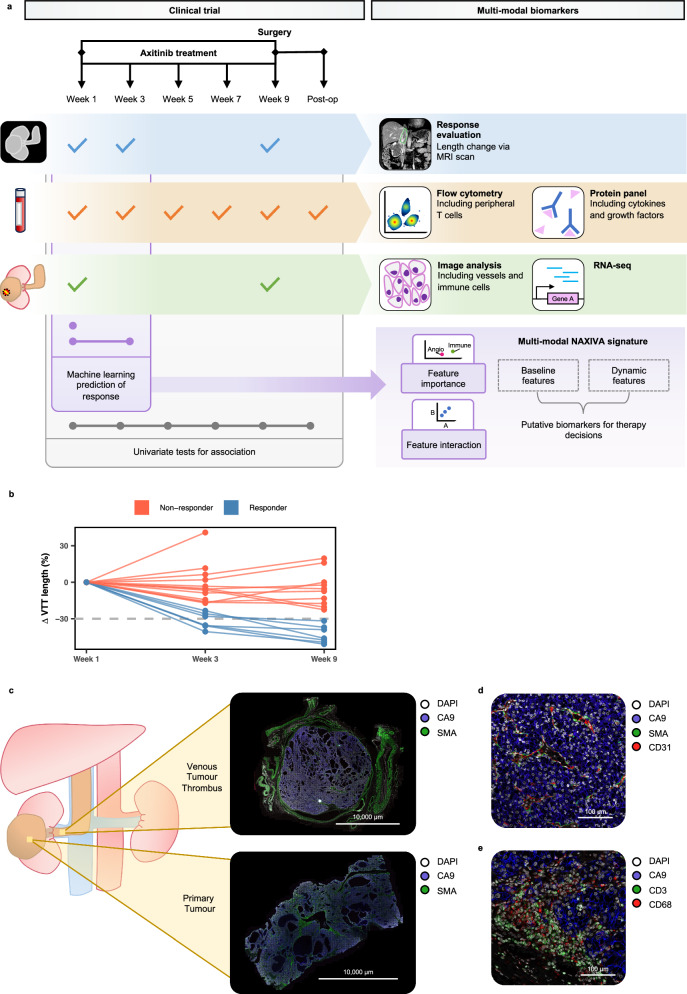
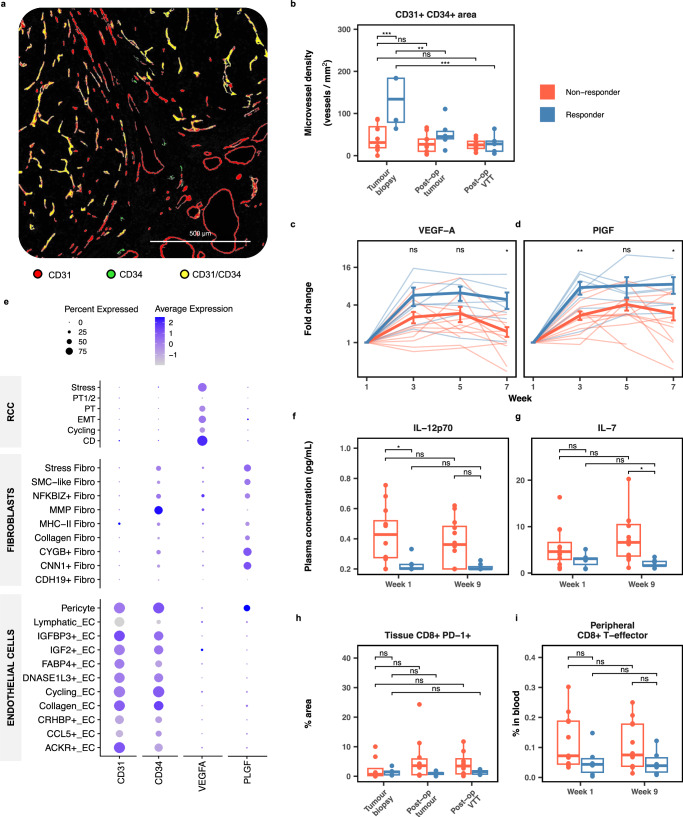
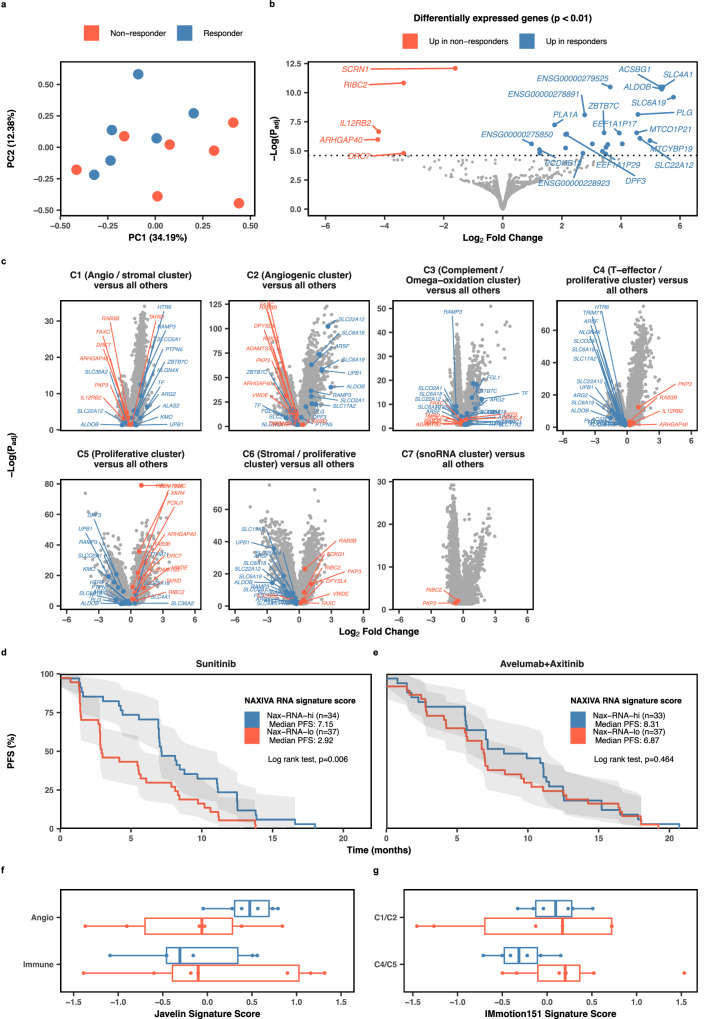
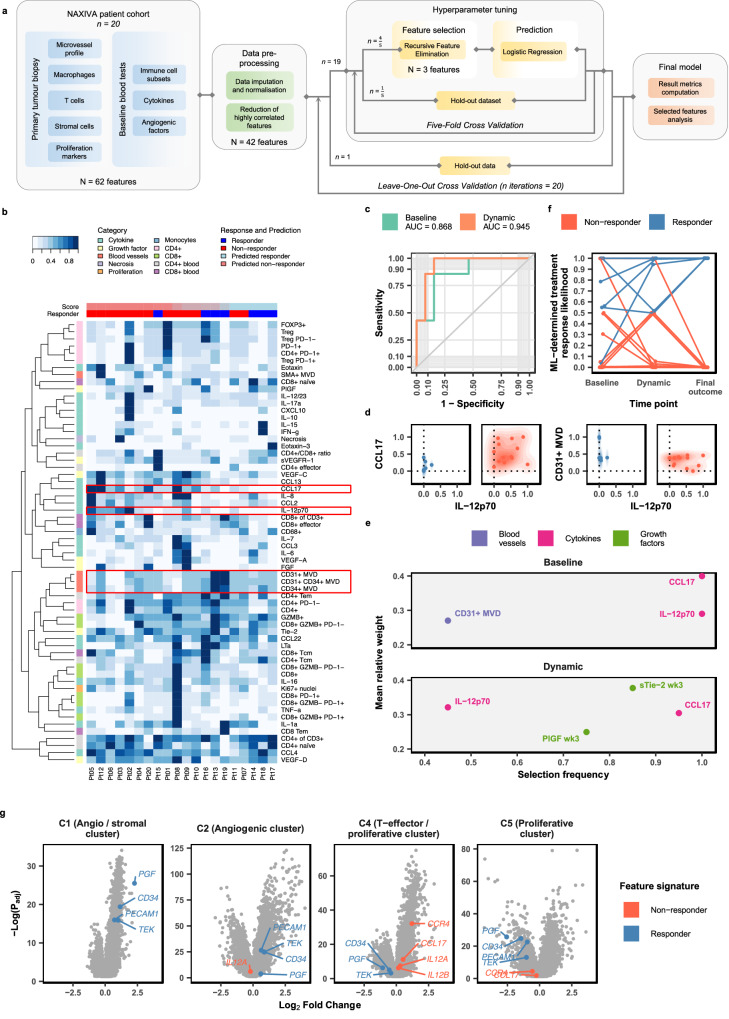
Venous tumour thrombus (VTT), where the primary tumour invades the renal vein and inferior vena cava, affects 10-15% of renal cell carcinoma (RCC) patients. Curative surgery for VTT is high-risk, but neoadjuvant therapy may improve outcomes. The NAXIVA trial demonstrated a 35% VTT response rate after 8 weeks of neoadjuvant axitinib, a VEGFR-directed therapy. However, understanding non-response is critical for better treatment. Here we show that response to axitinib in this setting is characterised by a distinct and predictable set of features. We conduct a multiparametric investigation of samples collected during NAXIVA using digital pathology, flow cytometry, plasma cytokine profiling and RNA sequencing. Responders have higher baseline microvessel density and increased induction of VEGF-A and PlGF during treatment. A multi-modal machine learning model integrating features predict response with an AUC of 0.868, improving to 0.945 when using features from week 3. Key predictive features include plasma CCL17 and IL-12. These findings may guide future treatment strategies for VTT, improving the clinical management of this challenging scenario.


Conflict of interest statement

Competing interests: The authors declare the following competing interests: H.P.: AstraZeneca (studentship). F.A.G.: research support from GE Healthcare; Grants from GSK; Consulting for AZ on behalf of the University of Cambridge. M.C.O.: 52 North Health Ltd (co-founder and employee), GE HealthCare (research funding), GSK (speaking fees). G.D.S.: Financial Interests – Evinova (consultancy, workshop on new product), British Journal of Urology International (Associate Editor) - paid role, NATCAN (Clinical Director (surgery) for the National Kidney Cancer), Audit (paid role), National Institute for Health and Care Excellence (Topic Advisor of kidney cancer guideline - paid role), AstraZeneca (Institutional Funding of the WIRE clinical trial); Non-Financial Interests - Getting It Right First Time (Principal Investigator, Chair of the kidney cancer pathway), British Association of Urological Surgeons (Member), European Association of Urology (Member); Other – MSD (Funded attendance at ESMO 2023). J.J.: Financial interests: Evinova (consultancy, workshop on new product), AstraZeneca (Institutional Funding of the WIRE clinical trial). The remaining authors declare no competing interests.

Figures

Fig. 1
Fig. 1. Multiparametric investigation of VTT response in the NAXIVA trial.
a Patients received up to 8 weeks of axitinib treatment. VTT response was evaluated by MRI at baseline, week 3 and week 9. Tissue was collected at baseline biopsy and at surgery from the VTT and primary tumour. Serial blood samples were taken before, during and after treatment. Research samples were assessed by a range of techniques to identify markers of response. Baseline and week 3 parameters were combined in a machine learning model for treatment response. b Patients reaching 30% reduction in VTT length by the end of the treatment course were classed as responders in the NAXIVA trial. 7 of 20 patients were classed as responders. ce Whole slide scans of VTT and paired primary tumour; representative images from five paired cases are shown. c CA9+ viable tumour filled the lumen of the renal vein. d CD31+ microvessels surrounded by SMA+ pericytes were abundant within the VTT TME. e CD3+ T cells and CD68+ macrophages were present within the VTT TME.
Fig. 2
Fig. 2. Responder and non-responder phenotypes.
a Representative image of HALO analysis markup of microvessels on multiplex immunofluorescence slides. b Responders had higher CD31+/CD34+ microvessel density pre-treatment than non-responders (one-way ANOVA with Tukey’s post-hoc test; p = 7.88 × 10−4 for responder vs non-responder tumour biopsies, p = 6.76 × 103 for responder post-op tumour vs tumour biopsy and p = 4.06 × 10−4 for responder post-op VTT vs tumour biopsy; n = 12 tumour biopsies [4 responders, 8 non-responders], 15 post-op tumour samples [6 responders, 9 non-responders] and 13 post-op VTT samples [5 responders, 8 non-responders]). c, d Fold change in plasma VEGF-A (c) and PlGF (d) relative to pre-treatment baseline (thin lines, individuals; bold lines, mean and standard error of the mean; unpaired two-sided Student’s t-test for responder to non-responder comparisons; p = 0.0118 for VEGF-A week 7, p = 3.38 × 10−3 for PlGF week 3 and p = 0.0203 for PlGF week 7; n = 19 for weeks 1–5 [7 responders, 12 non-responders], n = 18 for week 7 [7 responders, 11 non-responders]). e Single-cell RNA sequencing analysis of 12 untreated clear cell RCC showing expression of key angiogenesis genes by cell subset. f, g Responders had lower levels of IL-12p70 and IL-7 pre-treatment than non-responders (one-way ANOVA with Tukey’s post-hoc test; p = 0.0282 for IL-12p70 week 1 comparison and p = 0.0344 for IL-7 week 9 comparison; n = 19 [7 responders, 12 non-responders]). h, i Non-responders trended towards higher immune markers in the blood (n = 17 week 1 samples [6 responders, 11 non-responders] and 18 week 9 samples [6 responders, 12 non-responders]) and tissue (n = 13 tumour biopsies [5 responders, 8 non-responders], 16 post-op tumour samples [6 responders, 10 non-responders] and 13 post-op VTT samples [5 responders, 8 non-responders]) (one-way ANOVA with Tukey’s post-hoc test). All boxplots show the median (centre line), upper and lower quartiles (box bounds) and whiskers extending to 1.5× interquartile range. The source data for this figure are provided in the Source Data file. ns: p > 0.05, *p ≤ 0.05, **p ≤ 0.01, ***p ≤ 0.001.
Fig. 3
Fig. 3. RNA-seq analysis of baseline biopsies.
a PCA plot of RNA-seq data for pre-treatment biopsies of responder (n = 6) and non-responder (n = 7) tumours. b RNA-seq results comparing responder to non-responder biopsies via DESeq2. Labelled points are p < 0.01. Differential expression analysis was performed using DESeq2, applying a two-sided Wald test. P-values were adjusted for multiple comparisons using the Benjamini–Hochberg method to control the false discovery rate (FDR). Data are shown as Log2 fold changes with associated adjusted p-values. c Most differentially expressed genes (p < 0.05) plotted on the IMmotion151 RNA-seq clusters. Data, including statistical analysis, were directly extracted from the original study. d, e The most differentially expressed genes in NAXIVA (p < 0.05) stratified patients according to PFS in the Javelin Renal 101 study for the sunitinib arm (d) and not for the avelumab + axitinib arm (e). Grey shaded areas indicate the 95% confidence interval. f RNA signature scores for the NAXIVA patients in the transcriptomic signature identified in the Javelin Renal 101 study (n = 6 responders, 7 non-responders). g RNA signature scores for the NAXIVA patients in the transcriptomic signature identified in the IMmotion151 study (n = 6 responders, 7 non-responders). All boxplots show the median (centre line), upper and lower quartiles (box bounds) and whiskers extending to 1.5× interquartile range.
Fig. 4
Fig. 4. Machine learning model predicts response to axitinib.
a Machine learning model workflow. b Pre-processed data description and model-predicted scores for each patient. c Receiver operating characteristic curve. d Selection frequency for selected features (the number of times the feature was selected across the leave-one-out cross-validation iterations divided by the total number of iterations) and mean relative weight of features selected in more than 40% of the iterations. e Density plots of scaled values of two features with the highest selection frequency for responders and non-responders. f Prediction of response increased in accuracy and confidence when week 3 measurements are included in the analysis. g Signature from NAXIVA blood data displayed on IMmotion151 RNA-seq data. Data, including statistical analysis, were directly extracted from the original study. The source data for this figure are provided in the Source Data file.

Similar articles

Cited by

References

    1. Reese, A. C., Whitson, J. M. & Meng, M. V. Natural history of untreated renal cell carcinoma with venous tumor thrombus. Urol. Oncol. Semin. Orig. Investig.31, 1305–1309 (2013). - PubMed
    1. Martínez-Salamanca, J. I. et al. Lessons learned from the International Renal Cell Carcinoma-Venous Thrombus Consortium (IRCC-VTC). Curr. Urol. Rep.15, 404 (2014). - PubMed
    1. Psutka, S. P. & Leibovich, B. C. Management of inferior vena cava tumor thrombus in locally advanced renal cell carcinoma. Ther. Adv. Urol.7, 216–229 (2015). - PMC - PubMed
    1. Woodruff, D. Y. et al. The perioperative management of an inferior vena caval tumor thrombus in patients with renal cell carcinoma. Urol. Oncol. Semin. Orig. Investig.31, 517–521 (2013). - PubMed
    1. Mazumder, S., Higgins, P. J. & Samarakoon, R. Downstream targets of VHL/HIF-α signaling in renal clear cell carcinoma progression: mechanisms and therapeutic relevance. Cancers15, 1316 (2023). - PMC - PubMed

MeSH terms

Substances

LinkOut - more resources