Clinical Trial
. 2025 Apr 28;16(1):3968.
doi: 10.1038/s41467-025-59004-w.

Efficacy, safety and single-cell analysis of neoadjuvant immunochemotherapy in locally advanced oral squamous cell carcinoma: a phase II trial

Affiliations
Clinical Trial

Efficacy, safety and single-cell analysis of neoadjuvant immunochemotherapy in locally advanced oral squamous cell carcinoma: a phase II trial

Zhongzheng Xiang et al. Nat Commun. .

Abstract

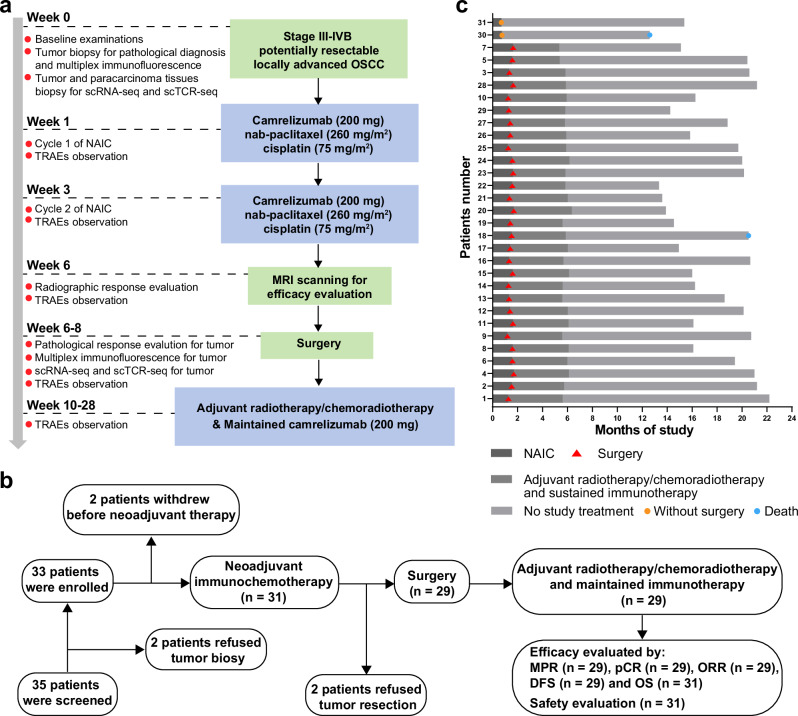
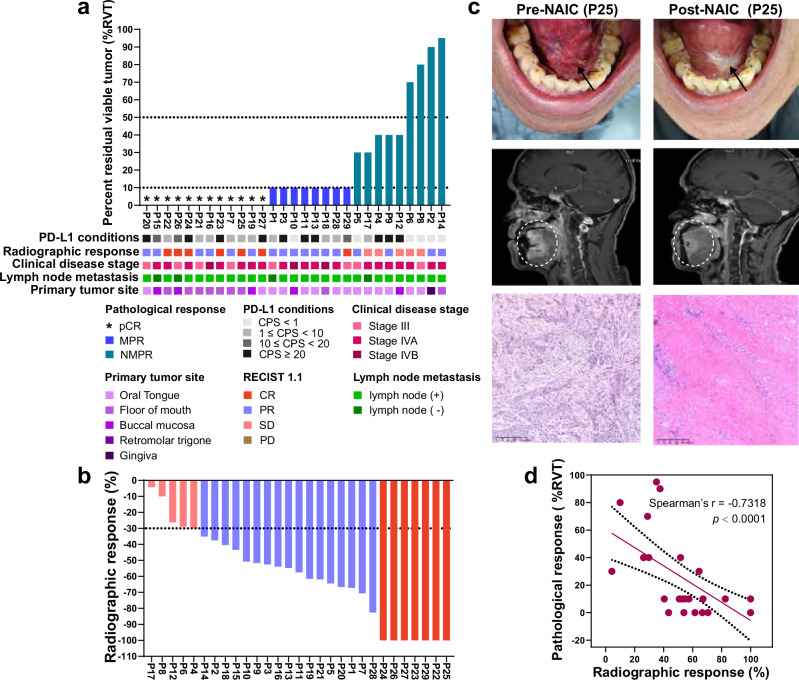
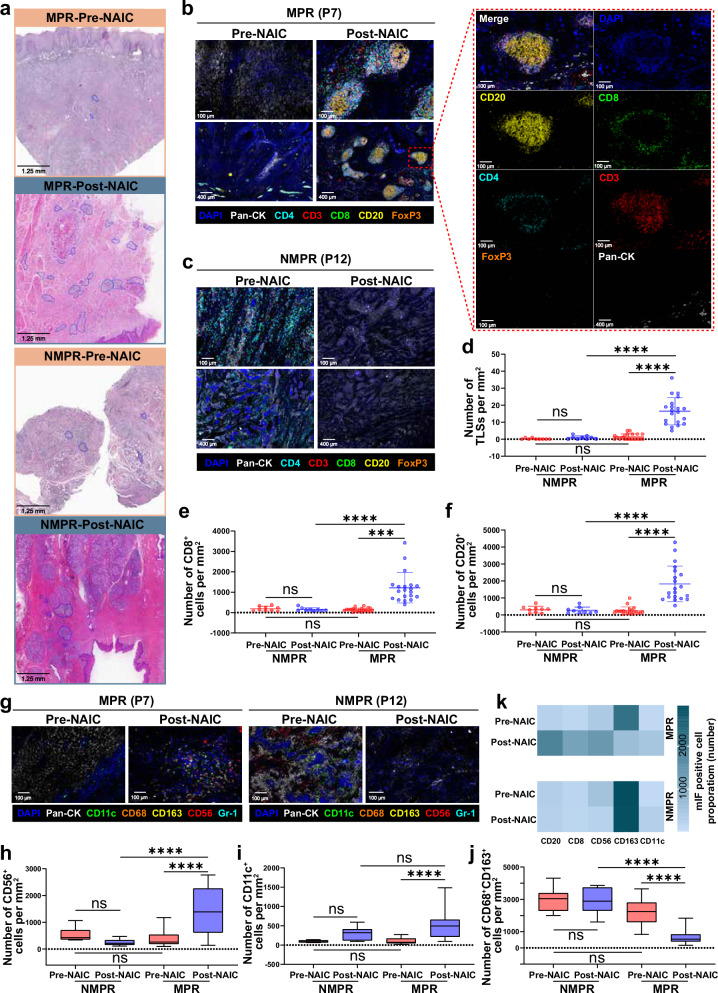
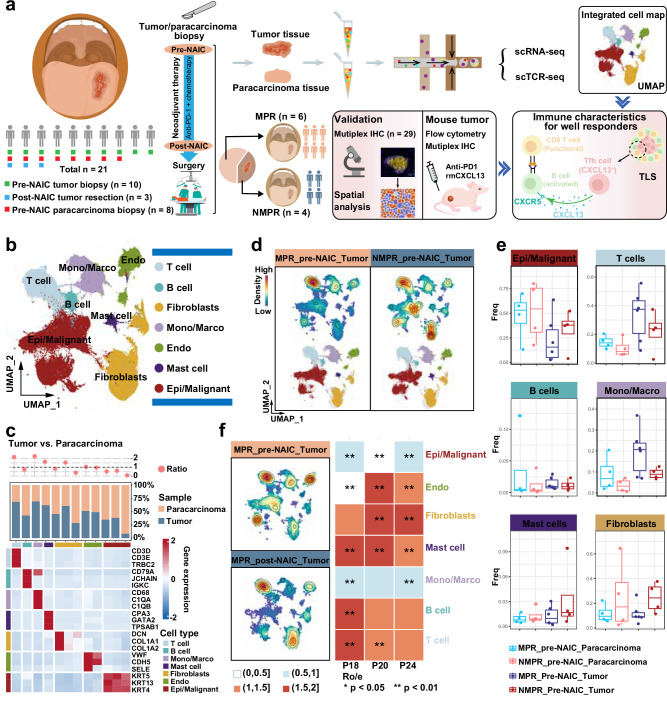
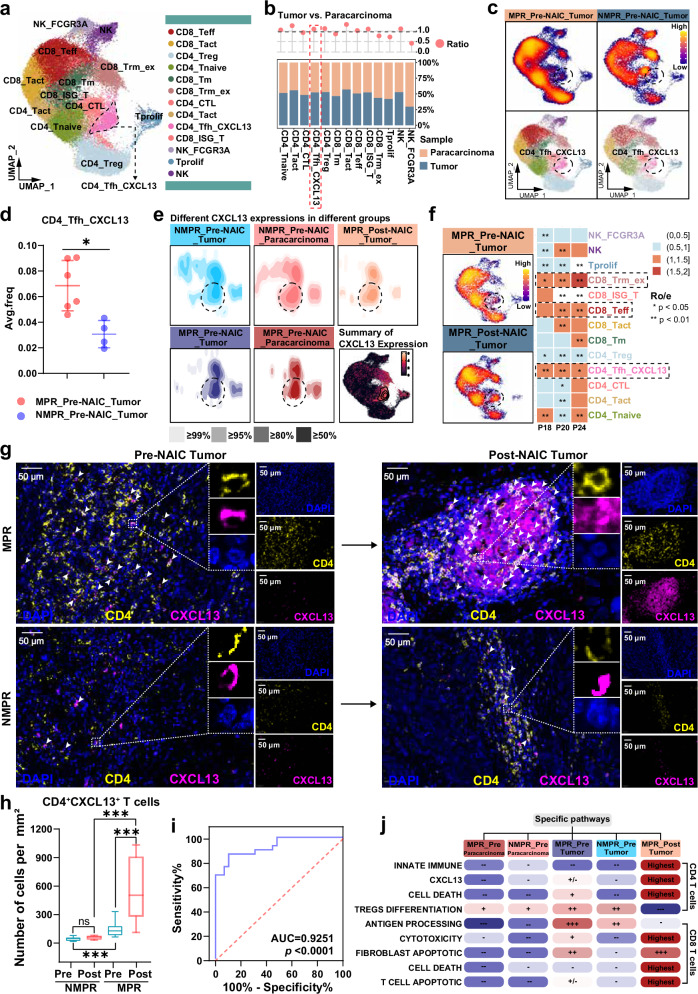
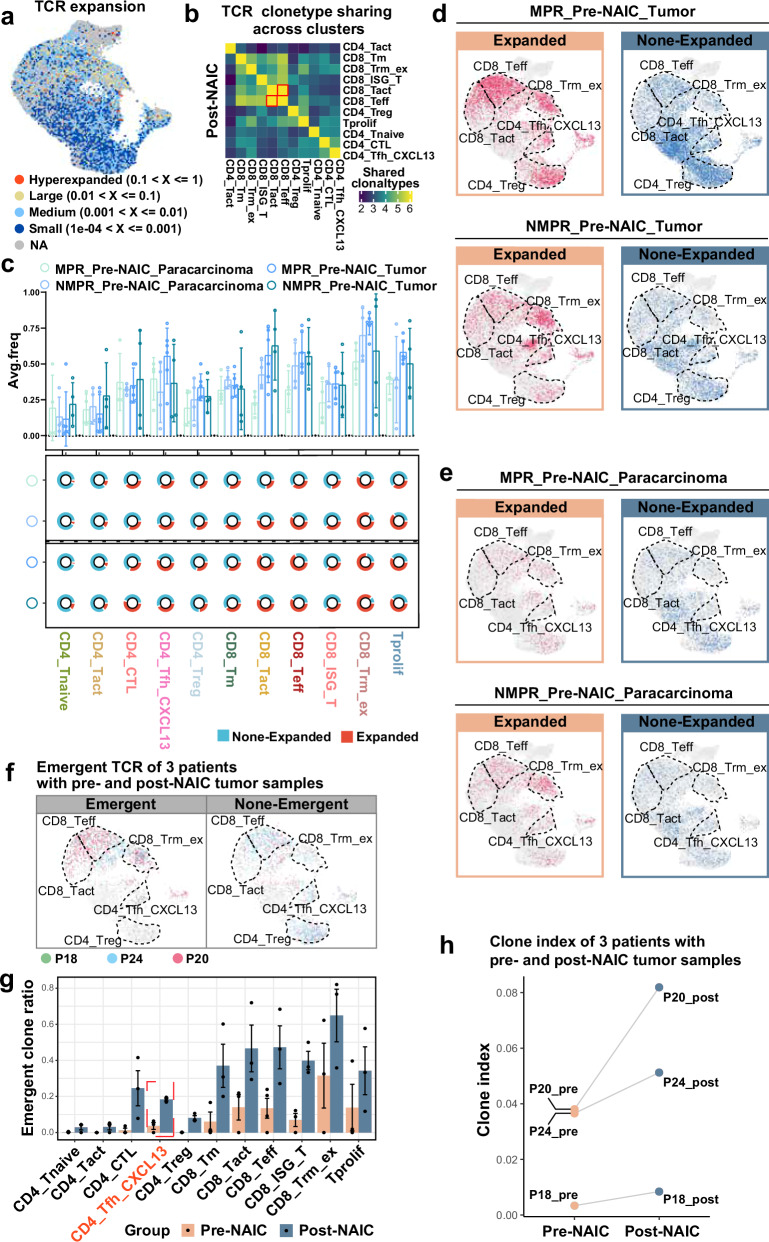
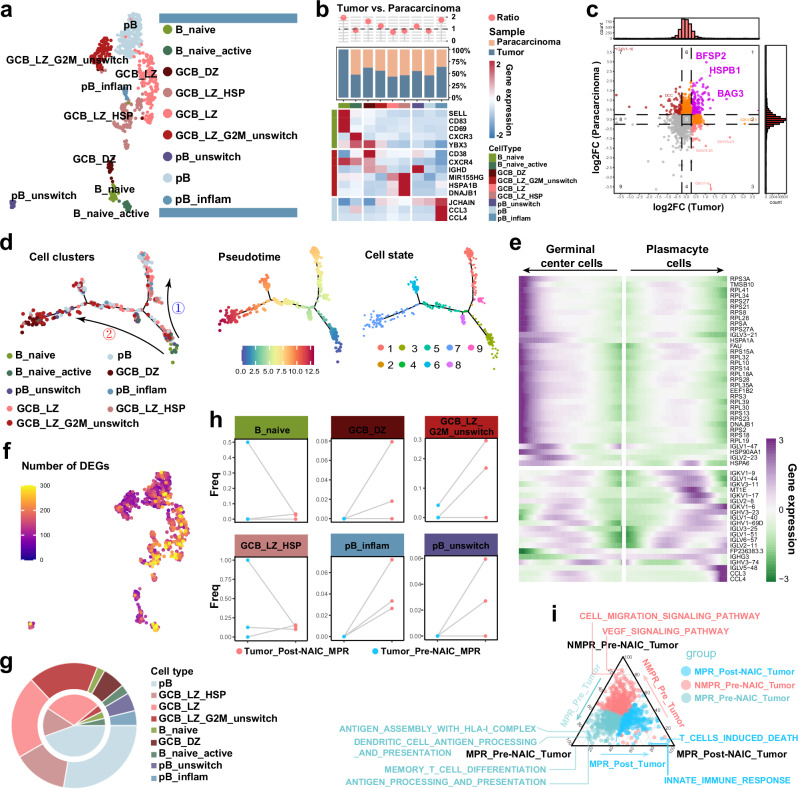
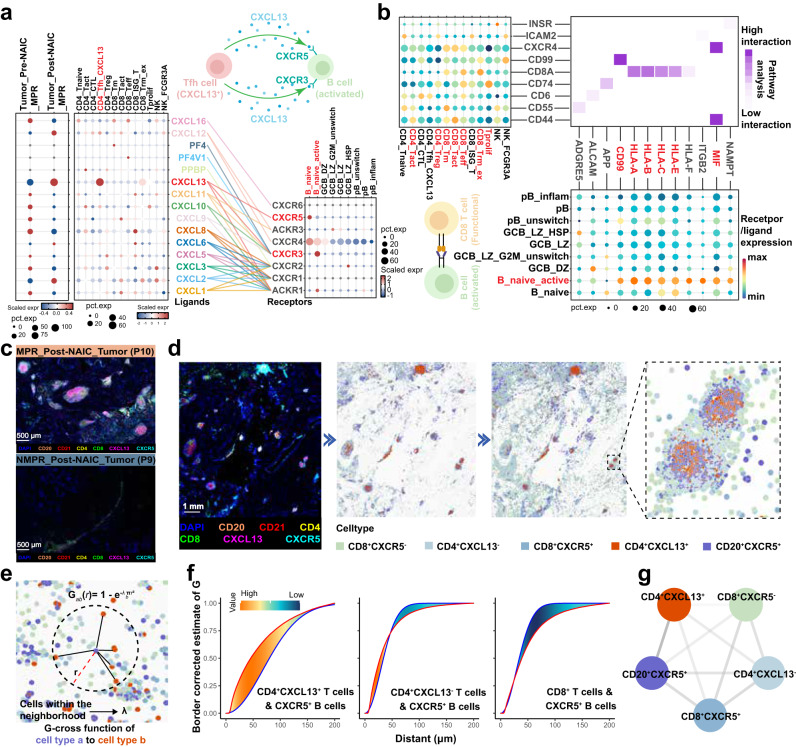
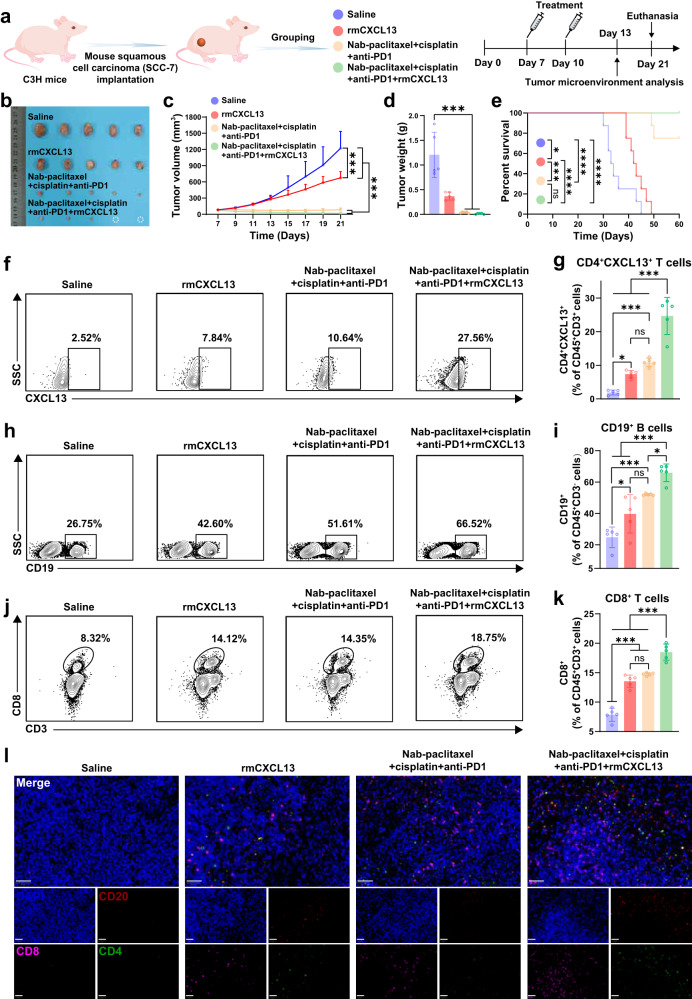
The clinical activity of neoadjuvant immunochemotherapy (NAIC) for treating locally advanced oral squamous cell carcinoma (LA-OSCC) remains uncertain. This single-arm, phase II trial (ChiCTR2200066119) tested 2 cycles of NAIC with camrelizumab plus nab-paclitaxel and cisplatin in LA-OSCC patients. For primary endpoint, the major pathological response (MPR) rate was 69.0% (95% confidence interval (CI): 49.2%-84.7%). The treatment was well-tolerated, with only 2 patients (6.45%) having grade 3 or 4 treatment-related adverse events during neoadjuvant treatment. For secondary endpoints, the pathological complete response rate was 41.4% (95%CI: 23.5%-61.1%) and the objective response rate was 82.8% (24/29, 95%CI: 64.2%-94.2%). The 18-month overall survival and disease-free survival probabilities were 96.77% (95%CI: 79.23%-99.54%) and 85.71% (95%CI: 53.95%-96.22%), respectively. Exploratory analysis showed that patients with MPR exhibited higher density of baseline CD4_Tfh_CXCL13 cells, and increased density of tertiary lymphoid structures after NAIC. Baseline CD4_Tfh_CXCL13 cells might be potential predictive biomarker of efficacy. The interaction between CXCL13 on CD4_Tfh_CXCL13 cells and CXCR5 on B cells may play a role in treatment response. These findings suggest the potential of NAIC as a promising treatment for LA-OSCC and offer preliminary insights into responsive biomarkers.


Conflict of interest statement

Competing interests: The authors declare no competing interests.

Figures

Fig. 1
Fig. 1. Study design.
a Trial schema. Eligible patients received 2 cycles of NAIC with camrelizumab plus nab-paclitaxel and cisplatin (every 3 weeks). Surgery was performed within 2–4 weeks after NAIC. Radiotherapy was performed within 6 weeks after surgery. Maintenance immunotherapy with 6 cycles of camrelizumab (every 3 weeks) was started simultaneously with radiotherapy. b Patient flowchart. c Treatment and follow-up status for each patient. OSCC, oral squamous cell carcinoma; NAIC, neoadjuvant immunochemotherapy; MPR, major pathologic response; NMPR, non-major pathologic response. Source data are presented as a Source Data file. Note, P30 and P31 refused surgical resection and imaging examination for personal reasons after receiving 2 cycles of NAIC, thus the pathological response (%RVT) and radiographic response of these two patients were unavailable. Created in Adobe Illustrator 2024.
Fig. 2
Fig. 2. Clinical responses to NAIC.
a Clinical characteristics and pathologic response. b Radiographic response per RECIST v1.1 criteria. c Representative image of patients who achieved MPR pre- and post-NAIC (n = 20), and this image was from patient P25. d Spearman correlation analysis between radiographic response and %RVT (Spearman r = −0.7318, p < 0.0001). The dotted lines represent a 95% confidence interval. The dot represents an individual data point. A two-sided test was used for statistical analysis. NAIC, neoadjuvant immunochemotherapy; MPR, major pathologic response; NMPR, non-major pathologic response; CPS, combined positive score; CR, complete response; PR, partial response; SD, stable disease; PD, progressive disease; %RVT, percent residual viable tumor. Source data are presented as a Source Data file.
Fig. 3
Fig. 3. Tertiary lymphoid structures and TME features in MPR and NMPR patients before and after NAIC.
a H&E staining, TLSs were marked by blue circles. b, c Multiplex immunofluorescence (mIF) staining for TLSs and TLS-related markers. df Quantification of TLSs (d), CD8+ T cells (e), and CD20+ B cells (f) based on mIF staining analysis in MPR (n = 20) and NMPR (n = 9) patients before and after NAIC in the tumor. Data are presented as mean values with standard deviation (SD), the dot represents an individual data point. Ordinary one-way ANOVA with Tukey’s multiple comparisons test was used for statistical analysis. g Representative mIF images showing dendritic cells (CD11c+), natural killer cells (CD56+), and M2-type tumor-associated macrophages (CD68+CD163+). hj Quantification of CD56+ (h), CD11c+ (i), and CD68+CD163+ cells (j) based on mIF staining analysis in MPR (n = 20) and NMPR (n = 9) patients before and after NAIC. Box plots show the distribution, the center line represents the median, the box indicates the upper and lower quartiles, and the whiskers represent minima and maxima. Ordinary one-way ANOVA with Tukey’s multiple comparisons test was used for statistical analysis. k Heatmaps illustrating the proportions of the above immune cells. TLSs, tertiary lymphoid structures; NAIC, neoadjuvant immunochemotherapy; MPR, major pathologic response; NMPR, non-major pathologic response. ns, not significant; ***P < 0.001, ****P < 0.0001. Source data and p-values are presented as a Source Data file.
Fig. 4
Fig. 4. Single-cell RNA-seq analyses of tumor and paracarcinoma tissues.
a Study workflow (Created in Adobe Illustrator 2024). b UMAP illustrations of all cell clusters. c Representative marker genes for each cell cluster and cell distribution characteristics in paracarcinoma and tumor tissues. d UMAP illustrations of the density of cell subtypes in MPR_pre-NAIC_Tumor and NMPR_pre-NAIC_Tumor samples. e Proportions of cell clusters among different groups, MPR_pre-NAIC_Paracarcinoma (n = 4), NMPR_pre-NAIC_Paracarcinoma (n = 4), MPR_Pre-NAIC_Tumor (n = 6), NMPR_Pre-NAIC_Tumor (n = 4). Box plots show the distribution (box and whiskers), the center line represents the median, the lower and upper the box limit represents the interquartile range (IQR), the whiskers represent the 1.5 × IQR. f UMAP illustrations of changes in the density of all cell subtypes and cell numbers comparison in paired pre- and post-NAIC tumor tissues (P18, P20, P24). A two-sided Chi-square test was used for statistical analysis. MPR, major pathologic response; NMPR, non-major pathologic response; Ro/e, the ratio of observed over expected cell numbers. p-values are presented as a Source Data file.
Fig. 5
Fig. 5. Identification of CD4_Tfh_CXCL13 cells by single-cell RNA-seq and multiplex immunofluorescence analysis.
a Sub-clustering of T/NK cells, colored and labeled by subtypes. b Distributions of cell subtypes in paracarcinoma and tumor tissues. c UMAP illustrations of changes in the number of T/NK cell subtypes in MPR- and NMPR tumor tissues before NAIC. d Frequencies comparison of CD4_Tfh_CXCL13 cells in MPR_pre-NAIC_Tumor (n = 6) and NMPR_pre-NAIC_Tumor (n = 4) samples. Data are presented as mean values with SD, the dot represents an individual data point. The two-sided Mann-Whitney U test was used for statistical analysis. e Different CXCL13 expressions in different groups. f UMAP illustrations of changes in the number of T/NK cell subtypes and cell density comparison in paired pre- and post-NAIC tumor tissues (P18, P20, P24). A two-sided Chi-square test was used for statistical analysis. g Representative mIF staining images of CD4+CXCL13+ cells in pre- and post-NAIC tumor tissues in MPR and NMPR patients (n = 29). White arrows represent CD4+CXCL13+ cells. h Comparison of CD4+CXCL13+ cells based on mIF staining analyses in NMPR_Pre-NAIC_Tumor (n = 9), NMPR_Post-NAIC_Tumor (n = 9), MPR_Pre-NAIC_Tumor (n = 20), MPR_Post-NAIC_Tumor (n = 20) samples. Box plots show the distribution, the center line represents the median, the box indicates the upper and lower quartiles, and the whiskers represent minima and maxima. The two-sided Mann-Whitney U test was used for statistical analysis. i Receiver operating characteristic curve analysis for baseline CD4+CXCL13+ cell density to predict the percentage of residual viable tumor (%RVT) after NAIC by Wilson/Brown method. j Specific pathways related to CD4+ and CD8+ T cells in different groups. MPR, major pathologic response; NMPR, non-major pathologic response; mIF, multiplex immunofluorescence; Ro/e, the ratio of observed over expected cell numbers. *P < 0.05, ***P < 0.001. Source data and p-values are presented as a Source Data file.
Fig. 6
Fig. 6. Characterization of TCR repertoire before and after NAIC.
a Landscape of TCR expansion. b TCR clonotype sharing in post-NAIC tumor tissue. c The percentages of clonal T cells in Pre-NAIC_Paracarcinoma (MPR_Pre-NAIC_Paracarcinoma, n = 4; NMPR_Pre-NAIC_Paracarcinoma, n = 4) and Pre-NAIC_Tumor samples (MPR_Pre-NAIC_Tumor, n = 6; NMPR_Pre-NAIC_Tumor, n = 4), top is Column chart, bottom is Pie chart, data are presented as mean values with SD, the dot represents an individual data point. d, e Projection of TCRs onto the UMAP embeddings of T cells in MPR_Pre-NAIC_Tumor and NMPR_Pre-NAIC_Tumor samples (d) and MPR_Pre-NAIC_ paracarcinoma and NMPR_Pre-NAIC_ paracarcinoma (e) samples. f Projection of emergent TCR onto the UMAP embeddings of T cells in paired pre- and post-NAIC tumor tissues (P18, P20, P24). g Column chart of emergent TCRs post-NAIC in (f) (Pre-NAIC, n = 3; Post-NAIC, n = 3), data are presented as mean values with SD, the dot represents an individual data point. h Clone index changes in paired pre- and post-NAIC tumor tissues (P18, P20, P24).
Fig. 7
Fig. 7. Increased infiltration of germinal center B cells after NAIC.
a Sub-clustering of B cells, colored and labeled by subtypes. b Representative marker genes for each cell cluster and fractions of all B cell subtypes in paracarcinoma and tumor tissues before NAIC. c Differentially expressed genes (DEGs) of pre-MPR and pre-NMPR between both paracarcinoma and tumor tissues. d Pseudotime trajectory analyses of all B cell subtypes in tumor tissue by Monocle2. e Heatmap showing scaled expression of DEGs across the pseudotime trajectory in (d). f UMAP color-coded of DEGs in each B cell subtype between pre-MPR and pre-NMPR in tumor tissues. g Pie chart of changes in B cell subtype composition before and after NAIC, outer represents post-NAIC, inner represents pre-NAIC. h Changes in infiltration of each B cell subetype for paired pre- and post-NAIC tumor tissues (P18, P20, P24) (Tumor_Pre-NAIC_MPR, n = 3; Tumor_Post-NAIC_MPR, n = 3). i Specific pathways in MPR_Pre-NAIC_Tumor, NMPR_Pre-NAIC_Tumor and MPR_Post-NAIC_Tumor samples. MPR, major pathologic response; NMPR, non-major pathologic response; GCB_DZ, germinal center B cells in the dark zone; GCB_LZ, germinal center B cells in the light zone.
Fig. 8
Fig. 8. Cell-cell communication and spatial analysis.
a Ligand-receptor analysis based on Cellchat; expression heatmap of chemokine genes in T cell clusters (left) and B clusters (right), and interactions are connected by colored lines (Cells figures were created in Adobe Illustrator 2024). b Ligand-receptor analysis based on Cellchat; dot plots show the top predicted ligands in B cells (bottom) and their targets in T cells (left); the heatmap shows the potential interaction (middle) (Cells figures were created in Adobe Illustrator 2024). c Comparision of mature phenotypes of tertiary lymphoid structures validated by mIF between MPR_Post-NAIC_Tumor (n = 20) and NMPR_Post-NAIC_Tumor (n = 9). The representative image was from patients P10 and P9, respectively. d Spatial analysis based on mIF staining slide (n = 3). The representative image was from patient P10. e, f G-cross function analysis of spatial distributions of CD8+CXCR5-, CD4+CXCL13-, CD8+CXCR5+, CD4+CXCL13+, and CD20+CXCR5+ cells. g Jaccard index analysis of CD8+CXCR5-, CD4+CXCL13-, CD8+CXCR5+, CD4+CXCL13+, and CD20+CXCR5+ cells. NAIC, neoadjuvant immunochemotherapy; MPR, major pathologic response; NMPR, non-major pathologic response.
Fig. 9
Fig. 9. CXCL13 augmented the anti-tumor immunity of immunochemotherapy in vivo.
a Schematic illustration of the experimental design (Created in Adobe Illustrator 2024). b Representative tumor images 14 days after treatment; white dotted circles indicate no residual tumor. c Tumor growth curves (n = 5 in each group), data are presented as mean values with SD. Two-way ANOVA with Tukey’s multiple comparisons test was used for statistical analysis. d Tumor weights measured 14 days after treatment (n = 5 in each group), data are presented as mean values with SD, the dot represents an individual data point. One-way ANOVA with Tukey’s multiple comparisons test was used for statistical analysis. e Mice survival curves. Log-rank test was used for statistical analysis. fk Ratios of CD4+CXCL13+ T cells (f, g), CD3-CD19+ B cells (h, i), and CD3+CD8+ B cells (j, k) in tumors, analyzed by flow cytometry (n = 5 in each group), data are presented as mean values with SD, the dot represents an individual data point. One-way ANOVA with Tukey’s multiple comparisons test was used for statistical analysis. l Multiplex immunofluorescence analysis of CD4+, CD8+ T cells and CD20+ B cells in tumor tissues; scale bar = 50 μm. ns, not significant; *p < 0.05, ***p < 0.001. Source data and p-values are presented as a Source Data file.

Similar articles

References

    1. Chai, A. W. Y., Lim, K. P. & Cheong, S. C. Translational genomics and recent advances in oral squamous cell carcinoma. Semin. Cancer Biol.61, 71–83 (2020). - PubMed
    1. Johnson, D. E. et al. Head and neck squamous cell carcinoma. Nat. Rev. Dis. Prim.6, 92 (2020). - PMC - PubMed
    1. Chamoli, A. et al. Overview of oral cavity squamous cell carcinoma: Risk factors, mechanisms, and diagnostics. Oral. Oncol.121, 105451 (2021). - PubMed
    1. Chow, L. Q. M. Head and neck cancer. N. Engl. J. Med.382, 60–72 (2020). - PubMed
    1. Zhong, L. P. et al. Randomized phase III trial of induction chemotherapy with docetaxel, cisplatin, and fluorouracil followed by surgery versus up-front surgery in locally advanced resectable oral squamous cell carcinoma. J. Clin. Oncol.31, 744–751 (2013). - PMC - PubMed

Publication types

MeSH terms