Comparative Study
. 2025 Apr 28;16(1):3982.
doi: 10.1038/s41467-025-59187-2.

Comprehensive comparison of the third-generation sequencing tools for bacterial 6mA profiling

Affiliations
Comparative Study

Comprehensive comparison of the third-generation sequencing tools for bacterial 6mA profiling

Beifang Lu et al. Nat Commun. .

Abstract

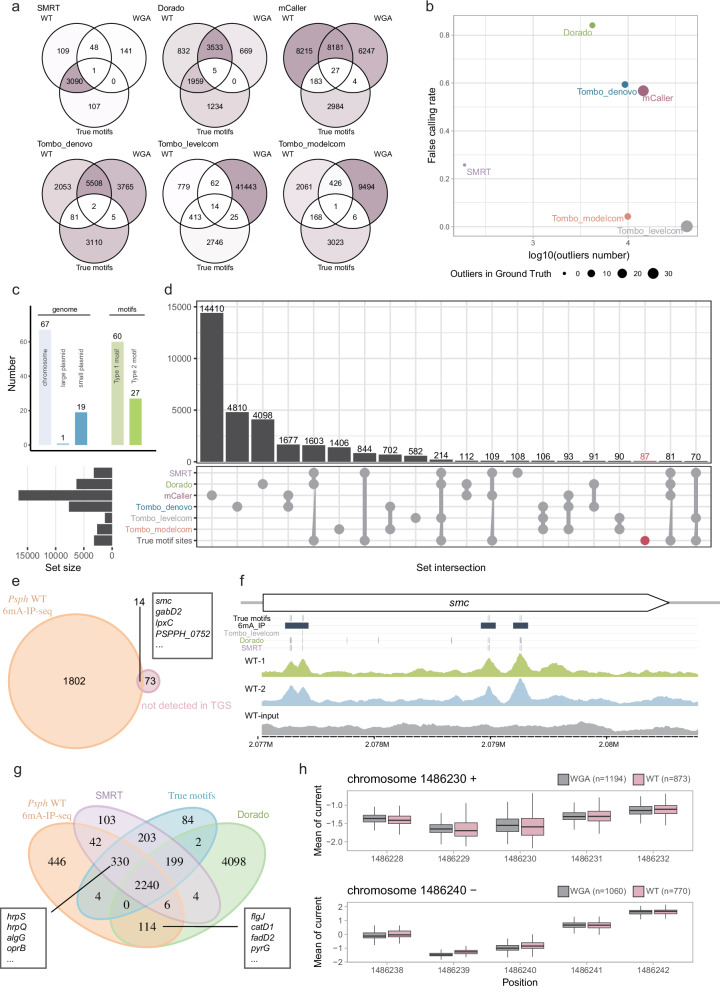
DNA N6-methyladenine (6mA) serves as an intrinsic and principal epigenetic marker in prokaryotes, impacting various biological processes. To date, limited advanced sequencing technologies and analyzing tools are available for bacterial DNA 6mA. Here, we evaluate eight tools designed for the 6mA identification or de novo methylation detection. This assessment includes Nanopore (R9 and R10), Single-Molecule Real-Time (SMRT) Sequencing, and cross-reference with 6mA-IP-seq and DR-6mA-seq. Our multi-dimensional evaluation report encompasses motif discovery, site-level accuracy, single-molecule accuracy, and outlier detection across six bacteria strains. While most tools correctly identify motifs, their performance varies at single-base resolution, with SMRT and Dorado consistently delivering strong performance. Our study indicates that existing tools cannot accurately detect low-abundance methylation sites. Additionally, we introduce an optimized method for advancing 6mA prediction, which substantially improves the detection performance of Dorado. Overall, our study provides a robust and detailed examination of computational tools for bacterial 6mA profiling, highlighting insights for further tool enhancement and epigenetic research.


Conflict of interest statement

Competing interests: The authors declare no competing interests.

Figures

Fig. 1
Fig. 1. Overview of the history of bacterial epigenetics, benchmarking strategy, and Nanopore sequencing data generated in this study.
a Timeline of important events in bacterial DNA modification studies throughout the past century. Key milestones are highlighted, with two major techniques of the TGS colored blue and orange. Other types of 6mA detection technologies are listed within the green dashed line box, while the orange dashed line box marks the five tools (Tombo has three sub-tools) for 6mA detection on Nanopore data that are evaluated in this research. b Diagram describing the processing workflow and benchmarking strategy. The left dashed line separates PacBio tools and ONT tools. The right dashed line separates the two types of sequencing files and corresponding tools from the flow cell R9.4.1 and R10.4.1. Created in BioRender. Huang, J. (2025) https://BioRender.com/x63f659. c Quality statistics of sequencing outputs based on four features. The gray color represents unmapped reads or bases. Centre line: median. Box bounds: 25th to 75th percentiles (interquartile range, IQR). Whiskers: extend to most extreme data points within 1.5 × IQR. WT wild type, WGA whole genome amplification. The n number for coverage is the genome size of Psph (n = 6538260).
Fig. 2
Fig. 2. Motif analysis in Psph.
a Venn diagram comparing the 6mA motifs between WT and ΔhsdMSR. The LOST set is determined to exclusively contain the type 1 6mA motifs. b The number of modified bases covered in each tool in four sets, categorized based on their operational capabilities. The tools are classified into two main types: Single Mode and Comparison Mode. Single mode tools are designed to process one set of sequencing data at a time, whereas comparison mode tools can analyze and compare two different data sets simultaneously. Additionally, the tools are further divided based on the type of nucleotide predictions they offer. 6mA-specific Tools are specialized for predictions exclusively on adenine modifications, while All Bases Available Tools are equipped to provide predictions across all types of nucleotides. The data sets used in this analysis, namely WT, ∆hsdMSR, LOST, and WGA, are detailed in the “methods” section. c Motifs enrichment -log10(p value) and the number of enriched sites determined by MEME-Streme. The top 10,000 6mA sites called by each tool are included in this analysis. Dots hit zero if no corresponding motif are discovered. Fisher’s exact test was applied to calculate the p value. d Histogram displaying the example of 6mA sites in the ground truth and Tombo_levelcom results. e Summary of motif discovery results in WT, ∆hsdMSR, and LOST set.
Fig. 3
Fig. 3. Comparative analysis of 6mA tools’ performance on site-level.
a Precision-Recall Curve (PRC) shows the overall detection performance of different tools. AP (average precision) values are indicated for each method. b Precision and recall values plotted against the logarithmic number of adenine sites for different detection tools. c Receiver operating characteristic (ROC) curve depicting the performance evaluation of six tools. Area under curve (AUC) values are shown for each tool. d True positive rate (TPR) and false positive rate (FPR) plotted against the logarithmic number of adenine sites. e The curve of the F1 score changes with the number of adenine sites included. f Heat map with the number indicated shows the optimal F1 score, the ROC value, and the AP value. Color intensity scales with numeric values, darker indicating higher values. g The curve of the F1 score changes with the modification fraction provided by SMRT and Dorado, indicating the single molecule level (per-read) accuracy. The ground truth dataset for Psph WT comprised all 6mA sites within type 1 and type 2 recognition motifs. h PRC with AP values. i Precision recall values with log-transformed adenine site count. j ROC curves with AUC values. k TPR and FPR values with log-transformed adenine site count. l The curve of the F1 score changes with the number of positive predictions. m Heat map with the number indicated shows the best F1 score reached, the ROC values, and the AP values. Color intensity scales with numeric values, darker indicating higher values. n The curve of the F1 score changes with the modification fraction provided by SMRT and Dorado, indicating the per-read accuracy. The ground truth dataset for PsphhsdMSR comprised all 6mA sites within type 2 recognition motifs. The small line plots in (e) and (l) provide a zoom-in view of the F1 score change as the number of adenines increases, focusing on the top 10,000 predictions. All outcomes from Tombo_denovo, Tombo_levelcom, and Tombo_modelcom are processed with a 5-mer shift as indicated in Methods. Source data are provided as a Source Data file. The curves of different colors represent the results of predictions using different tools, marked at the bottom. TPR true positive rate. FPR false positive rate.
Fig. 4
Fig. 4. Assessment of intrinsic false calling and demonstration of Nanopore current.
a Venn diagram illustrating the overlaps among the obtained results of WT, outliers, and the ground truth from canonical motifs. Each tool follows the cutoff determined by the best F1 score achieved in the previous analysis of the WT dataset. No shifts are assayed in the 5-mer region. b Bubble plot displaying the log-transformed number of outliers and the false calling ratio. The false calling ratio is calculated by dividing the number of outliers by the total number of sites called in the WT dataset. The size of the bubbles represents the intersection of outliers with ground truth. The outliers represent the results obtained from processing WGA sequencing files. c The bar plot illustrating the distribution of 87 methylation sites across chromosomes and their corresponding motif types. d Upset plot presenting the six tools’ results after being filtered with a determined cutoff. The vertical bars represent the size of each set, with the largest set on the left and the top 20 sets displayed. The horizontal bars indicate the number of features unique to each tool, and the dots and connecting lines show the intersections between different sets of tools but exclude the contents in the intersections of all tools. Sites colored in rose red represent the number of true 6mA sites that were not identified in all TGS tools without shifting. e Venn diagram shows the overlap between Psph WT 6mA-IP-seq results and the 87 sites undetected by TGS. f Peak defined by 6mA-IP-seq and 6mA sites detected by different tools are visualized by “r.trackplot”. g The Venn diagram depicting the overlapping methylation sites identified by 6mA-IP-seq, SMRT, Dorado, and canonical motif analysis in Psph WT. h Box plot showcasing the region encompassing 6mA motif GAG-N6-GCTG, with the assigned current at each position sourced from nanoCEM. Centre line: median. Box bounds: 25th to 75th percentiles (interquartile range, IQR). Whiskers: extend to most extreme data points within 1.5 × IQR.
Fig. 5
Fig. 5. Optimized method and down-sampling experiment of Dorado.
a Schematic plot shows the optimized method. Created in BioRender. Huang, J. (2025) https://BioRender.com/g4dqgr0. b, c F1 score change curve depicting the variation in performance with different numbers of adenines considered. The small line plots zoom in on the top 20,000 predictions, providing a closer examination. d Heat map illustrating the best F1 score observed during the optimization process, the minimal assigned values among all predictions, precision values, and FPR values. Color intensity scales with numeric values, darker indicating higher values. e Distribution of assigned values across different outputs at varying coverage levels. f Correlation score calculated using Pearson’s method among six types of input coverage. g Venn diagram showing the intersection of candidate sites generated by Dorado. The cutoff is determined based on the best F1 score. Color intensity scales with numeric values, darker indicating higher values. hj Evaluation across different input coverage through the presentation of the F1 score curve, PRC, and ROC analysis. The ground truth dataset comprised all 6mA sites within type 1 and type 2 recognition motifs. Source data are provided as a Source Data file.
Fig. 6
Fig. 6. Cross-validation of 6mA detection methods across five bacterial strains.
a Characteristic methylation motif identified in five bacterial strains. The left phylogenetic tree shows the relationships among five bacterial strains. Quantitative metrics displaying: modification fraction for SMRT and Dorado, number of motif occurrences detected by each tool, and motif enrichment significance for Tombo. The likelihood ratio test was applied to calculate the e-value. b Heatmap showing modification fraction corresponding to the optimal F1 scores in the single-molecule resolution comparison of Dorado and SMRT. c Heatmap showing the maximum F1 scores in the site-resolution evaluation. d Genomic coverage analysis showing the adenine site coverage by different detection tools. e Ratio of optimal predictions to validated 6mA sites in respective bacterial genomes. f Distribution of F1 scores across five bacterial strains displaying the performance of tools: Dorado, Dorado_optimized, and SMRT. g Comparative analysis in E. coli K-12 of SMRT predictions from WT sample, outliers (SMRT predictions from ∆dam/dcm sample), and two types of canonical motifs through Venn diagram representation. h Venn diagram showing the overlaps pattern of Dorado, optimized Dorado predictions, and canonical motif-based ground truth in E. coli K-12. i Venn diagram illustrating the overlap between DR-6mA-seq results, SMRT detection, Dorado predictions, and canonical motif-based ground truth in E. coli K-12. (bd, gi) Color intensity scales with numeric values, darker indicating higher values. Source data are provided as a Source Data file.

Similar articles

Cited by

References

    1. Johnson, T. B. & Coghill, R. D. Researches on pyrimidines. C111. The discovery of 5-methyl-cytosine in tuberculinic acid, the nucleic acid of the tubercle bacillus. J. Am. Chem. Soc.47, 2838–2844 (1925).
    1. Waddington C. H. The epigenotype. Endeavour1, 18–20 (1942).
    1. Knelman, F., Dombrowski, N., Newitt, D. M. & Woodcock, A. H. Occurrence of a new base in the deoxyribonucleic acid of a strain of Bacterium coli. Nature175, 336–337 (1955). - PubMed
    1. Mccarthy et al. The enzymatic methylation of RNA and DNA, ii. on the species specificity of the methylation enzymes*. Proc. Natl. Acad. Sci. USA50, 164–169 (1963). - PMC - PubMed
    1. Mattei, A. L., Bailly, N. & Meissner, A. DNA methylation: a historical perspective. Trends Genet.38, 676–707 (2022). - PubMed

Publication types

MeSH terms

LinkOut - more resources