. 2025 Apr 28;16(1):3957.
doi: 10.1038/s41467-025-58452-8.

Investigative needle core biopsies support multimodal deep-data generation in glioblastoma

Collaborators, Affiliations

Investigative needle core biopsies support multimodal deep-data generation in glioblastoma

Kenny K H Yu et al. Nat Commun. .

Abstract

Glioblastoma (GBM) is an aggressive primary brain cancer with few effective therapies. Stereotactic needle biopsies are routinely used for diagnosis; however, the feasibility and utility of investigative biopsies to monitor treatment response remains ill-defined. Here, we demonstrate the depth of data generation possible from routine stereotactic needle core biopsies and perform highly resolved multi-omics analyses, including single-cell RNA sequencing, spatial transcriptomics, metabolomics, proteomics, phosphoproteomics, T-cell clonotype analysis, and MHC Class I immunopeptidomics on standard biopsy tissue obtained intra-operatively. We also examine biopsies taken from different locations and provide a framework for measuring spatial and genomic heterogeneity. Finally, we investigate the utility of stereotactic biopsies as a method for generating patient-derived xenograft (PDX) models. Multimodal dataset integration highlights spatially mapped immune cell-associated metabolic pathways and validates inferred cell-cell ligand-receptor interactions. In conclusion, investigative biopsies provide data-rich insight into disease processes and may be useful in evaluating treatment responses.


Conflict of interest statement

Competing interests: C.B. is a consultant for: Depuy-Synthes, GalecVn Therapeutics, Haystack Oncology, Privo Technologies and Bionaut Labs, and co-founder of OrisDx and Belay Diagnostics. A.B. is on the Scientific Advisory Board in an unpaid capacity for Evren Technologies and is an inventor on the following patents: 62/258,044, 10/413,522, and 63/052,139, as well as the US Provisional Patent Applications No. 63/449,817, and 63/449,823, and the International Patent Application No. PCT/US24/18343 filed by MSKCC. M.H. is on the Data Safety Monitoring board for Paraxel, Advarra; on the Scientific Advisory Board for Bayer, AnHeartTherapeuVcs Inc, and Servier; and speaking engagement with Novartis. D.R. is a consultant for: AnHeart Pharmaceuticals, Aptitude Health, BlueRock Therapeutics LP, CeCaVaGmbH & Co.KG, Chimeric Therapeutics, Elsevier, Enterome, F. Hoffman La-Roche, Genenta Science, Inovio, Insightec, Janssen, Jupiter Life Sciences Consulting, LLC, Kintara, Kiyatec, Johnson & Johnson, Pharma, Lumanity, Menari Stemline, Miltenyi Biomedicine GmbH, Neuvogen, Novocure, Paradigm Medical Communications, Putnam Inizii Associates, LLC, Sumitono Dainippon Pharma Oncology, Servier, Triangle Insights Group, Vivacitas Oncology, Inc., WebMD; and is on the Data Safety Monitoring Board for ImVax, CeCaVaGmbH; Private Investment in AnHeart Therapeutics, Bionaut Lab, and has received research funding via DFCI from Acerta Phamaceuticals, Agenus, Ashvattha Therapeutics, Boehringer Ingelheim, Bristol-Myers Squibb, Corbus Pharma, EMD Serono, Enterome, Epitopoietic Research Corporation, Incyte, Inovio, Insightec, Invios, Merck, Medicenna Therapeutics, Mogling Bio, NeoTx Ltd, Numiera Therapeutics, Sapience Therapeutics, SphereBio, Vaccinex. P.S. is on the Scientific Advisory Board for: Achelois, Akoya Biosciences, Affini-T, Apricity, Asher Bio, BioAtla LLC, Candel Therapeutics, Catalio, C-Reveal Therapeutics, Dragonfly Therapeutics, Earli Inc, Enable Medicine, Glympse, Henlius/Hengenix, Hummingbird, ImaginAb, InterVenn Biosciences, LAVA Therapeutics, Lytix Biopharma, Marker Therapeutics, Matrisome, NTx, Oncolytics, Osteologic, PBM Capital, Phenomic AI, Polaris Pharma, Soley Therapeutics, Spotlight, Trained Therapeutix Discovery, Two Bear Capital, Vironexis, Xilis, Inc. Private Investment: Adaptive Biotechnologies, BioNTech, JSL Health, Sporos, Time Bioventures. N.A. is a consultant for: Bruker; on the Scientific Advisory Board for: National Brain Tumor Society and received research support from Thermo, EMD Serono and iTeos Therapeutics. R.B. was previously on the Scientific Advisory Board for: Scorpion Therapeutics, co-founder of Karyoverse Therapeutics; owns equity in Karyoverse Therapeutics and Takeda Therapeutics. M.C. is a consultant for: Dare Bioscience, Johnson and Johnson; is director at GelMEDIX Inc., and director and founder of Stratagen Bio. K.L.L. has interests not directly related to the study: Equity holder: Travera Inc., Consultant: Travera Inc, Servier, Bristol-Myers Squibb, Integragen, L.E.K. Consulting, Blaze Bioscience; and received research funding to DFCI: via Bristol-Myers Squibb and Eli-Lilly. L.C.-H. is a consultant for Servier. F.M. is a co-founder of and has equity in Harbinger Health, has equity in Zephyr AI, and serves as a consultant for both companies. She is also on the board of directors of Recursion Pharmaceuticals. None of these relationships are directly or indirectly related to the content of this manuscript. The rest of the authors do not have competing interests to declare.

Figures
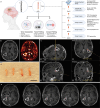
Fig. 1
Fig. 1. Intra-operative collection and coordination of sample core distribution and analyses.
a Schematic diagram demonstrating multiple core sampling and proposed analysis methods. Note that the biopsy needle can rotate along its axis and perform multiple biopsies from the same fixed position. b MR imaging of patient undergoing resection of lesion. Left, T1 weighted imaging with contrast. Right, MR perfusion imaging demonstrating “hotspot” on the anteromedial portion of tumor, destined for resection. c Intra-operative neuro-navigated imaging demonstrating the trajectory and position of biopsy needle in 3 orthogonal planes and inline view. d Representative pictures of multiple biopsy cores (scale bar = 10 mm). e Core sampling locations geospatially mapped back to original MR imaging using 3D slicer software. QC quality control, PDX patient-derived xenografts. (a) was generated with Biorender.
Fig. 2
Fig. 2. Optimization of single-cell workflow for fresh GBM biopsy cores.
a Comparison of manual versus automated tissue dissociation and single-cell RNA sequencing with and without translation inhibitors (n = viable cell yield). b Ex vivo activation (ExAM) score in myeloid population with and without inhibitors under automated and manual dissociation conditions. Boxes are bound at the 25th and 75th percentile with the center line being at the median. The dots represent minima and maxima of the data. c UMAP showing cellular populations using mechanical only versus enzymatic dissociation and subsequent ExAM score in low volume simulated biopsy tissue. d UMAP showing cellular populations and proportions from actual patient biopsy sample using manual dissociation technique. Lower boxes represent higher-level annotations subpopulation analysis within the lymphocytic and myeloid populations. e Direct comparison of glioma-associated macrophage gene expression between frozen tissue derived single-cell nuc-seq versus fresh cell single-cell sequencing from a common originating sample showing significant reduction in key myeloid-related genes in frozen nuc-seq data. f Decision tree for single-cell processing workflow for stereotactic biopsy samples (Data from 4 different patient samples shown, a, b resection tissue, c simulated biopsy tissue, d actual patient biopsy tissue used for multimodal analysis, e resection tissue used for parallel scRNA and snRNA analysis).
Fig. 3
Fig. 3. CODEX Analysis of core biopsy sample.
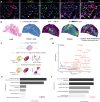
a CODEX panel and representative image showing all biomarker staining. b Nearest Neighbor analysis showing distance of CD3+ T cells and CD68+ macrophages to the GFAP+ cells. c Pie chart showing different subpopulations present within the pilot tissue sample. d Spatial location of Cellular Neighborhood (CN) as seen on the biopsy tissue. Stack plot represents the frequency of different CN. e Neighborhood analysis shows different cellular clusters contributing to form different CN.
Fig. 4
Fig. 4. The depth of proteomic, phosphoproteomic, and immunopeptidomic analysis on GBM core biopsy.
a Unique proteins and phosphoproteins quantified are ranked by their abundance. The names of select proteins and phosphoproteins associated with tumor progression and immune infiltration are shown. b Gene ontology terms associated with proteins and phosphoproteins that were quantified. Groups that had intersection sizes above 3 are shown. c The number of 8 to 11-mer peptides identified by immunopeptidomic analysis. d The number of proteins that gave rise to MHC peptides. e Motif analysis of the quantified immunopeptidome using Gibbs clustering. f MHC peptides quantified from the core biopsy were compared to the HLA Ligand Atlas of the benign human brain. Previously reported cancer-testis antigens (CTNNA2, SPAG17) and predicted CTAs (CTCFL) are labeled along the immunopeptides that were ranked based on their abundance.
Fig. 5
Fig. 5. Integrated spatial proteomics and metabolomics on GBM biopsy core.
a Representative CyCIF zoom-ins displaying CD45, OLIG2, CD14 and GFAP (scale bar = 50 µm). b Hematoxylin and Eosin staining, and corresponding spatial distribution of immune cells (CD45+), Adenosine triphosphate (ATP), Malate, and Linoleic acid metabolism enrichment with immune cells (CD45+) overlayed. The distribution of ATP is anticorrelated, while Malate and Linoleic acid metabolism show strong spatial colocalization to immune cells. c Diagram summarizing the integration of CyCIF and MALDI-MSI of consecutive tissue sections. This includes image registration, Pearson’s correlation of the number of CD45+ cells per pixel to all metabolites, and pathway enrichment analysis. d Comparison of metabolism between immune and non-immune regions of the tissue. e Pathways enriched in non-immune regions of the tissue. f Pathways enriched in immune regions of the tissue.
Fig. 6
Fig. 6. Integrative analysis of single patient-derived multi-omics data.
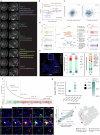
a Core sampling locations and proposed analysis methods. b Comparison of pathway enrichment analysis of immune vs non-immune cells using spatial metabolomics and scRNAseq. r = Pearson correlation coefficient. c Correlation between the abundance of MHC peptides and their matching transcripts and proteins. R = Pearson correlation coefficient. d Correlation of abundance of MHC peptides with corresponding cellular subsets as identified by scRNAseq. e Comparison of CODEX protein data to GeoMx-WTA data using corresponding regions of interest. Multiplex immunofluorescence was performed on the biopsied section showing selected ROIs (left panel). Protein expression for phenotypic markers by CODEX (middle) and immune cell deconvolution from GeoMx-WTA (right) showing the distribution of cell type scores of immune cell subtypes in the selected ROIs. f Rank plot displaying the communication probability of all predicted cell-cell interactions and ligand-receptor interactions as determined by CellChat using scRNAseq data. Points highlighted represent the SPP1-CD44 ligand-receptor pair. The bottom stripe graph indicates ligand-receptor pairs with activated receptors according to phosphoproteomics data. The vertical line indicates the transition between highly probable (green) and unlikely (red) interactions. g Spatial neighboring frequency analysis using CyCIF. Highly specific markers identify cell types: CD8 (T-cells), TMEM119 (Microglia), CD14 (Monocytes), SOX2 (MES-like), SOX9 (NPC-like), and OLIG2 (OPC-like). Cells positive for both OPN+ and CD44+ are considered targets, and their neighboring frequency to presumed sources is quantified in a network connecting all cells with centroids within 50 μm of each other. The statistical significance of these frequencies is assessed using a Monte Carlo approach by permuting the cell labels 1000 times. h Representative CyCIF zoom-ins showing cell-cell interactions involving OPN and CD44: Microglia-CD8 T-cells (top), Microglia-MES-like (middle), and Microglia-Monocyte (bottom). i Correlation plot between Communication Probability (scRNAseq + CellChat) and the statistical significance of the neighboring frequency analysis in CyCIF. Spearman’s ρ = 0.02, p = 0.02. j Main interactions identified by CyCIF neighboring frequency analysis within the context of the whole tissue section. DSP digital spatial profiling.
Fig. 7
Fig. 7. Multi-regional sampling variance analysis.
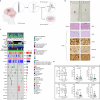
a A recurrent GBM is resected en-bloc and samples are taken from 3 separate regions of the tumor (labeled 1–3). b CNV analysis shows low tumor purity in samples 1a and 1b, PBMC control sample is also included in the last track. c Phylogenetic analysis demonstrating common shared events such as chromosome 7 gain and 10 loss followed by branching differences separated by sample of origin. d Diagram representing the microregions sampled with each needle core biopsy. e Pre-operative T1 contrast-enhanced and T2 image showing the location of the lesion. f Representative H&E sections from each core (top) with corresponding segmentation (bottom) performed with a machine learning model trained on contours by a neuropathologist (TB). g The segmentation maps are randomly subsampled multiple times to derive a distribution of sampled imaging features from each sample. This distribution is visualized using PCA and statistically compared across microregions using linear mixed effects (LME). Microregion 2 is statistically distinct from the other two microregions. Sample 1c is an outlier within microregion 1 due to an increase in necrotic features. (d) was generated with Biorender.
Fig. 8
Fig. 8. In vivo and in vitro modeling of glioblastoma from stereotactic needle core biopsy.
a Stereotactic needle core biopsies were obtained from 30 HGG patients, QC metrics determined, and used in 26 PDX and 22 PDCL attempts. b Representative tissue sections from two patients demonstrate the small size of stereotactic needle biopsy cores and microscopic glioma histology, as well as clear evidence of PDX glioma histology via positive immunohistochemical staining for clinically reliable glioma markers. c 42% (11/26) of PDX attempts and 23% (5/22) of PDCL attempts were successful for a cohort of patients that demonstrated a diversity of histopathological, clinical, and tumor genomic characteristics. d Neuropathologist-estimated tumor percentage and measured biopsy mass, and cell viability in biopsy samples with correlations to model generation success (n = biological replicates). Boxes are bound at the 25th and 75th percentile with the center line being at the median. The whiskers for plots are the minima and maxima of the data. The statistical test used was an unpaired, two-tailed t-test with significance determined as p < 0.05. HGG high-grade glioma, PDX patient-derived xenograft, PDCL patient-derived cell line. (a) was generated with Biorender.

Update of

  • Investigative needle core biopsies for multi-omics in Glioblastoma.
    Yu KKH, Basu S, Baquer G, Ahn R, Gantchev J, Jindal S, Regan MS, Abou-Mrad Z, Prabhu MC, Williams MJ, D'Souza AD, Malinowski SW, Hopland K, Elhanati Y, Stopka SA, Stortchevoi A, He Z, Sun J, Chen Y, Espejo AB, Chow KH, Yerrum S, Kao PL, Kerrigan BP, Norberg L, Nielsen D; GBM TeamLab; Puduvalli VK, Huse J, Beroukhim R, Kim YSB, Goswami S, Boire A, Frisken S, Cima MJ, Holdhoff M, Lucas CG, Bettegowda C, Levine SS, Bale TA, Brennan C, Reardon DA, Lang FF, Antonio Chiocca E, Ligon KL, White FM, Sharma P, Tabar V, Agar NYR. Yu KKH, et al. medRxiv [Preprint]. 2023 Dec 31:2023.12.29.23300541. doi: 10.1101/2023.12.29.23300541. medRxiv. 2023. Update in: Nat Commun. 2025 Apr 28;16(1):3957. doi: 10.1038/s41467-025-58452-8. PMID: 38234840 Free PMC article. Updated. Preprint.

References

    1. Weller, M. et al. Glioma. Nat. Rev. Dis. Prim.1, 15017 (2015). - PubMed
    1. Stupp, R. et al. Radiotherapy plus concomitant and adjuvant temozolomide for glioblastoma. N. Engl. J. Med.352, 987–996 (2005). - PubMed
    1. Stupp, R. et al. Effects of radiotherapy with concomitant and adjuvant temozolomide versus radiotherapy alone on survival in glioblastoma in a randomised phase III study: 5-year analysis of the EORTC-NCIC trial. Lancet Oncol.10, 459–466 (2009). - PubMed
    1. Stupp, R. et al. Effect of tumor-treating fields plus maintenance temozolomide vs maintenance temozolomide alone on survival in patients with glioblastoma: a randomized clinical trial. JAMA318, 2306–2316 (2017). - PMC - PubMed
    1. Cloughesy, T. F. et al. Neoadjuvant anti-PD-1 immunotherapy promotes a survival benefit with intratumoral and systemic immune responses in recurrent glioblastoma. Nat. Med.25, 477–486 (2019). - PMC - PubMed