. 2025 Apr 28;16(1):3958.
doi: 10.1038/s41467-025-59297-x.

DNA damage in proximal tubules triggers systemic metabolic dysfunction through epigenetically altered macrophages

Affiliations

DNA damage in proximal tubules triggers systemic metabolic dysfunction through epigenetically altered macrophages

Erina Sugita Nishimura et al. Nat Commun. .

Abstract

DNA damage repair is a critical physiological process closely linked to aging. The accumulation of DNA damage in renal proximal tubular epithelial cells (PTEC) is related to a decline in kidney function. Here, we report that DNA double-strand breaks in PTECs lead to systemic metabolic dysfunction, including weight loss, reduced fat mass, impaired glucose tolerance with mitochondrial dysfunction, and increased inflammation in adipose tissues and the liver. Single-cell RNA sequencing analysis reveals expansion of CD11c+ Ccr2+ macrophages in the kidney cortex, liver, and adipose tissues and Ly6Chi monocytes in peripheral blood. DNA damage in PTECs is associated with hypomethylation of macrophage activation genes, including Gasdermin D, in peripheral blood cells, which is linked to reduced DNA methylation at KLF9-binding motifs. Macrophage depletion ameliorates metabolic abnormalities. These findings highlight the impact of kidney DNA damage on systemic metabolic homeostasis, revealing a kidney-blood-metabolism axis mediated by epigenetic changes in macrophages.


Conflict of interest statement

Competing interests: The authors declare no competing interests.

Figures
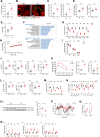
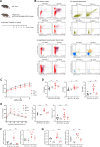
Fig. 1
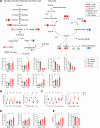
Fig. 1. Continuous nonmutagenic DNA damage in PTECs causes systemic metabolic changes.
A I‒PpoI cutting efficacy of rDNA in isolated PTECs from the I-PpoI and WT mice. B Representative photomicrographs of immunofluorescence (IF) staining of γH2AX (green)/AQP1 (red) in the kidney cortex. The experiment was repeated with similar results three times. C Real-time RT‒PCR analysis of biomarkers of renal proximal tubule injury in the renal cortex. D Serum BUN and Cr levels at 16 weeks of age. E The amount of albuminuria at 16 weeks of age. F Kyoto Encyclopedia of Genes and Genomes (KEGG) pathway enrichment analysis (upper) and Gene Ontology enrichment analysis (lower) for upregulated differentially expressed genes. The graph shows the log p-value calculated using the Benjamini‒Hochberg-corrected two-tailed t test for the enrichment of a specific pathway. G Real-time RT‒PCR analysis of genes related to fatty acid metabolism in the renal cortex. H Time course of body weight. I The weights of VAT (left), SAT (middle) and BAT (right) at 16 weeks of age. J Serum ALT, ALP, TG and FFA levels at 16 weeks of age. K (left) Ip-GTT and area under the curve (AUC) for glucose values 0–120 min after glucose load at 16 weeks of age. (right) Fasting serum insulin levels at 16 weeks of age. L Hepatic FC and the ratio of FC to TC at 16 weeks of age. M, N Real-time RT‒PCR analysis of genes related to fatty acid metabolism in the liver (M) and genes involved in lipolysis and adipose differentiation in VAT (N). O (a) Western blot analysis of PPARγ protein. b Band intensity of PPARγ relative to GAPDH. P The RQ (VCO2/VO2) values determined by indirect metabolic calorimetry (CLAMS). Q, R Real-time RT‒PCR analysis of genes associated with cellular senescence in the kidney cortex (Q) and SASP-associated genes and senescence markers in the kidney (Ra), the liver (Rb) and VAT (Rc). Tg (the I-PpoI), 16-week-old γGT-Cre+ ROSA26-STOP-I-PpoI; WT, 16-week-old wild type. In A, CE, GI, LN, (Q), and R, n = 6 samples in each group. In K and P, n = 4 in each group. In (J), n = 8 in each group. The data are presented as the means ± SEMs. *p < 0.05, **p < 0.01 vs. the control; N.S., not significant. Scale bars, 20 µm in (B). Source data are provided as a Source Data file.
Fig. 2
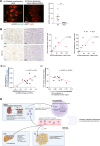
Fig. 2. Metabolomic analyzes revealed that DNA damage in PTECs causes alterations in glucose and lipid metabolism in the kidney and liver.
A The metabolic steps of glycolysis, the TCA cycle (upper left) and the urea cycle (upper right). Red and light red squares show that the levels of each metabolite increased in the I-PpoI mice (Tg) (p < 0.01 or < 0.05, respectively); blue and light blue squares show that the levels of each metabolite decreased in the I-PpoI mice (p < 0.01 or < 0.05, respectively). (lower) The apparent contents per tissue weight of representative metabolites involved in glycolysis and the TCA cycle [nmol/g tissue weight]. B, C Real-time RT‒PCR analysis of key rate-limiting enzymes in the glycolytic pathway, such as HK, PFK, PK, BCAT1 and BCAT2 and gluconeogenic enzymes including G6Pase, PEPCK and PCK in the kidney (B) and the liver (C). D The apparent contents per tissue weight of essential amino acids in the kidney and the liver [nmol/g tissue weight]. E The apparent ratio of NADH/NAD in the kidney and liver (left). The apparent energy charge was calculated by the following equation: apparent energy charge = (ATP + [0.5 × ADP])/(ATP + ADP + AMP) (right). All values are presented as the means ± SEMs. *p < 0.05, **p < 0.01 vs. the control; N.S., not significant. n = 6 samples in each group. Source data are provided as a Source Data file.
Fig. 3
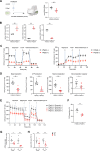
Fig. 3. PTEC DNA damage causes mitochondrial dysfunction in cultured PTECs.
A Schematic diagram outlining the experimental design for cultured PTECs. Created in BioRender. https://BioRender.com/egn26ya (B) Real-time RT‒PCR analysis of biomarkers of renal proximal tubule injury and the rate-limiting enzyme involved in fatty acid β-oxidation in cultured PTECs overexpressing I-PpoI and controls. C OCR of cultured PTECs overexpressing I-PpoI and controls measured in a Seahorse XF24 system. Oligomycin, an inhibitor of ATP synthesis (1.5 μM), carbonyl cyanide 4-(trifluoromethoxy) phenylhydrazone (FCCP), a mitochondrial oxidative phosphorylation uncoupler (1.0 µM) and rotenone/antimycin A (0.5 μM), a complex I/III inhibitor, were injected sequentially at the indicated time points. D Basal and maximal OCRs, ATP production and storage respiration capacity in cultured PTECs overexpressing I-PpoI and controls. E OCR of cultured PTECs overexpressing I-PpoI and controls measured in a Seahorse XF24 system. Etomoxir, an irreversible inhibitor of CPT1 (4 µM), Oligomycin (1.5 μM), FCCP (1.0 µM) and rotenone/antimycin A (0.5 μM) were injected sequentially at the indicated time points. F Fatty acid oxidation (FAO) dependency in cultured PTECs overexpressing I-PpoI and controls. G Mitochondrial DNA copy number in the kidney and the liver. H Real-time RT‒PCR analysis of PGC-1α, a key regulator of mitochondrial biogenesis in the kidney and the liver. In A, G and H, n = 6 samples in each group. In B, E and F, n = 4 samples in each group. In C and D, n = 8 samples in each group. Each data point represents the mean ± SEMs. *p < 0.05, **p < 0.01 vs. the control. Source data are provided as a Source Data file.
Fig. 4
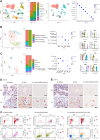
Fig. 4. Single-cell RNA-seq analysis revealed infiltration of activated macrophages in the kidney cortex following DNA damage in PTECs.
A UMAP plots of the single-cell data classified by cell clusters (left), relative proportions of cells in the I-PpoI (Tg) and WT mice (middle left) and sample information (middle right). Expression of selected marker genes for each cell classification (right). The color of the dot is proportional to the average expression value, and the size is expressed as a percentage. B UMAP plots of subclusters of macrophages (left) and proportions of the subgroups in the I-PpoI and WT mice (middle left). C UMAP plots of subclusters of DCs, monocytes and neutrophils (left) and proportions of the subgroups in the I-PpoI and WT mice (middle left). Expression of selected marker genes for each classification (middle right). The color of the dot is proportional to the average expression value, and the size is expressed as a percentage. Violin plots showing the expression levels of selected genes characterized in the clusters (right). The y-axis shows the log-scale normalized read count. D, E Representative immunohistochemical staining images with an anti-CD11b antibody (D) an anti-CD11c antibody (E) and in the kidney cortex (a), the liver b and VAT c at 16 weeks of age. F Representative FACS plots of the kidney cortex a, VAT b, and peripheral blood mononuclear cells (PBMCs) (c) of I-PpoI and WT mice at 16 weeks of age (left). Proportions of CD11b+ or CD11c+ macro`phages in the kidney and VAT and those of CD11b+ Ly6chi monocytes in PBMCs, as assessed by flow cytometry (right). In ac n = 4 samples in each group. The data are presented as the means ± SEMs. *p < 0.05, **p < 0.01 vs. the control. Scale bars, 20 µm (left) and 100 µm (middle and right) in D and E. The same results were obtained by four different samples in each group. Source data are provided as a Source Data file.
Fig. 5
Fig. 5. The effects of I-PpoI-induced DSBs on changes in DNA methylation in peripheral blood cells in the I-PpoI mice.
A Significant signaling pathways of hypermethylated DMRs specifically in blood cells of the I-PpoI mice (Tg) compared to those in blood cells of WT mice. B Significant signaling pathways of hypomethylated DMRs specifically in blood cells of the I-PpoI mice compared to those in blood cells of WT mice. C The top 5 enriched motifs in hypomethylated DMRs, including promoter regions and CpG islands, of blood cells in the I-PpoI mice according to regulatory sequence analysis tools. For each motif, the corresponding Bonferroni-adjusted p value (E value) and the number of input sequences containing the specific motif (n in parenthesis) are listed on top of the motif logo. The known JASPAR transcription factors are listed below the corresponding logo. D Relative methylation rate of Gasdermin D (GSDMD) in blood cells of the I-PpoI mice compared to those in blood cells of WT mice. **p < 0.01 vs. the control. Source data are provided as a Source Data file.
Fig. 6
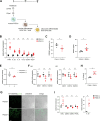
Fig. 6. In vitro experiments of cultured murine adipocytes in conditioned medium from activated macrophages.
A Schematic diagram outlining the experimental design for cultured adipocytes in conditioned medium from activated murine macrophage RAW 264.7 cells that had been transferred into the medium of murine PTECs following transfection with I-PpoI. Created in BioRender. https://BioRender.com/7yyff15 (B) Real-time RT‒PCR analysis of inflammatory cytokines such as IL-1β, TNFα, Ccr2, GSDMD and KLF9 in the RAW 264.7 cells. C Real-time RT‒PCR analysis of DNA methylation levels of the GSDMD promoter region in the RAW 264.7 cells. D The concentration of high mobility group box protein-1 (HMGB1) in the culture supernatant of cultured murine PTECs. E Relative promoter activity of pCpG-free promoter plasmid containing GSDMD promoter without or with methylase SssI (−/+). (F) a Real-time RT‒PCR analysis of DNA methyltransferases (DNMTs) in exosomes released by cultured murine PTECs following transfection with I-PpoI. b Real-time RT‒PCR analysis of DNMTs in the murine RAW 264.7 macrophages cultured with the exosomes. G Representative photomicrographs of IF staining of NT-GSDMD (green) in the RAW 264.7 cells. Scale bar, 10 µm. The experiment was repeated with similar results three times. H IL-1β levels in the supernatant of the RAW 264.7 cells to which the supernatant of cultured murine PTECs with or without DNA damage was added. I Real-time RT‒PCR analysis of inflammatory cytokines such as IL-1β and TNFα and genes involved in lipolysis and adipose differentiation in the cultured murine adipocytes in conditioned medium with the supernatant of macrophages activated by PTECs transfected with I-PpoI. The data are presented as the means ± SEMs. In B, (DH) and I, n = 6 samples in each group. In C, n = 4 samples in each group. *p < 0.05, **p < 0.01 vs. the control; N.S., not significant. Source data are provided as a Source Data file.
Fig. 7
Fig. 7. Macrophage depletion restored metabolic alterations in the I-PpoI mice.
A Schematic diagram outlining the experimental design for macrophage depletion. Created in BioRender. https://BioRender.com/442s6k4 (B) Representative FACS plots of the kidney cortex a, VAT b, and PBMCs c of the I-PpoI (Tg) and WT mice at 16 weeks of age with or without clodronate (left). Proportions of CD11b+ and CD11c+ macrophages in kidney and visceral adipose tissue and of CD11b+ Ly6chi monocytes in PBMCs, as assessed by flow cytometry (n = 3, 3). C Time course of body weight. D Serum BUN, Cr and TG levels of the I-PpoI and WT mice at 16 weeks of age with or without clodronate. E (left) ip-GTT and AUC for glucose values 0–120 min post glucose load of the I-PpoI and WT mice at 16 weeks of age with or without clodronate. (right) Fasting serum insulin levels of the I-PpoI and WT mice at 16 weeks of age with or without clodronate. F Real-time RT‒PCR analysis of proinflammatory markers in the liver. G Real-time RT‒PCR analysis of proinflammatory markers in visceral adipose tissue. In CG, n = 4 samples in each group. The data are presented as the means ± SEMs. *p < 0.05, **p < 0.01 vs. the control; N.S., not significant. Source data are provided as a Source Data file.
Fig. 8
Fig. 8. Association of DNA double-strand breaks (DSB) in PTECs with macrophage activation in human kidney biopsy samples from patients diagnosed with diabetic nephropathy (DN) or minor glomerular abnormalities (MGA).
A (Left) Representative photomicrographs of IF double staining of γH2AX (green)/AQP1 (red) in the kidney cortex of patients with DN (a) or MGA (b). Scale bar, 50 µm. (right) Quantification of the immunolabeled double-positive area. B (left) Representative photomicrographs of immunohistochemical staining with anti-CD11b or anti-CD11c antibodies in the kidney cortex of patients diagnosed with DN (a) or MGA (b). Scale bar, 50 µm. (right) Correlation between the γH2AX-positive area and the CD11b- or CD11c-positive area. γH2AX-, CD11b- and CD11c-positive areas were counted per field of view. Scale bar, 50 µm. C (a) Correlation between the extent of DNA damage in PTECs using the DNA damage in the SGLT2 gene and DNA methylation at the CpG site cg22012530 in the TSS1500 region. b Correlation between DNA methylation at the CpG site cg22012530 in the TSS1500 region and the hepatic steatosis index (HSI). D Graphical abstract of the study. DNA DSBs in PTECs cause not only metabolic alterations in the kidney but also DNA methylation in blood cells, including reduced DNA methylation at KLF9-binding motifs, such as GSDMD, which triggers the expansion of activated Ly6Chi Ccr2+ monocytes in blood. The activated monocytes subsequently trigger systemic metabolic disturbances associated with macrophage activation. Created in BioRender. https://BioRender.com/rrfwed6. In A and B, n = 5 samples in each group. In C, n = 12 samples in each group. The clinical data are presented in Supplementary Table 1 and 2, respectively. The data are presented as the means ± SEMs. **p < 0.01 vs. the control. Source data are provided as a Source Data file.

Similar articles

References

    1. Sedelnikova, O. A. et al. Senescing human cells and ageing mice accumulate DNA lesions with unrepairable double-strand breaks. Nat. Cell Biol.6, 168–170 (2004). - PubMed
    1. Yang, J. H. et al. Loss of epigenetic information as a cause of mammalian aging. Cell186, 305–326.e327 (2023). - PMC - PubMed
    1. Global, regional, and national burden of chronic kidney disease, 1990-2017: a systematic analysis for the Global Burden of Disease Study 2017. Lancet395, 709–733 (2020). - PMC - PubMed
    1. Asghar, M. S. et al. Age-Based Versus Young-Adult Thresholds for Nephrosclerosis on Kidney Biopsy and Prognostic Implications for CKD. J. Am. Soc. Nephrol.34, 1421–1432 (2023). - PMC - PubMed
    1. Xiang, F. et al. Premature aging of circulating T cells predicts all-cause mortality in hemodialysis patients. BMC Nephrol.21, 271 (2020). - PMC - PubMed

MeSH terms

Substances

LinkOut - more resources