. 2025 Apr 28;15(1):14818.
doi: 10.1038/s41598-025-98630-8.

Differential behavior responses and genetic alteration underpinning exercise effectiveness in stress-susceptible mice

Affiliations

Differential behavior responses and genetic alteration underpinning exercise effectiveness in stress-susceptible mice

Dong-Joo Hwang et al. Sci Rep. .

Abstract

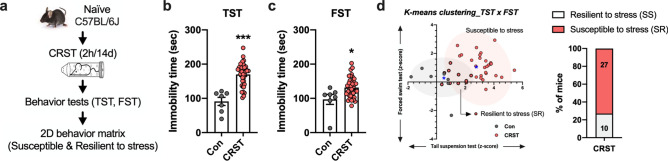
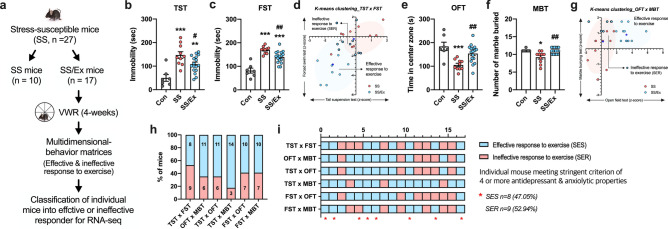
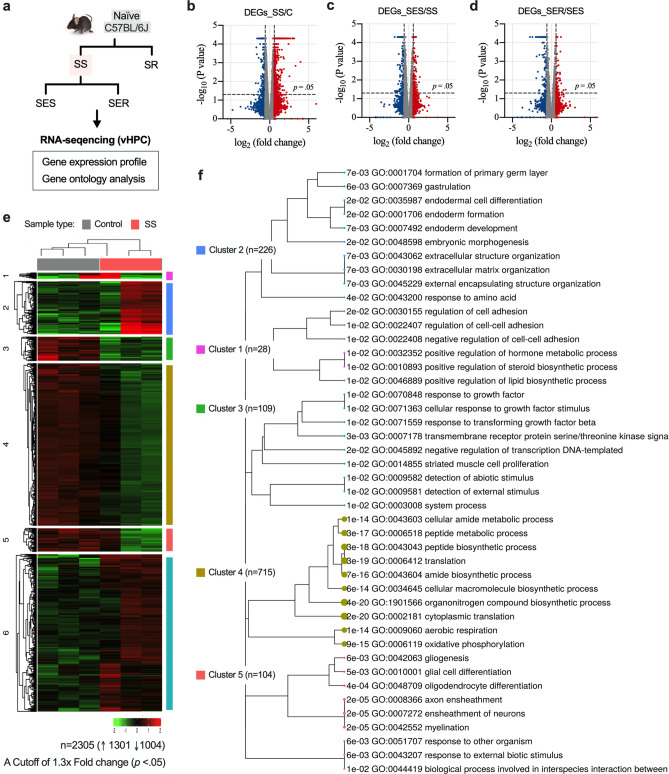
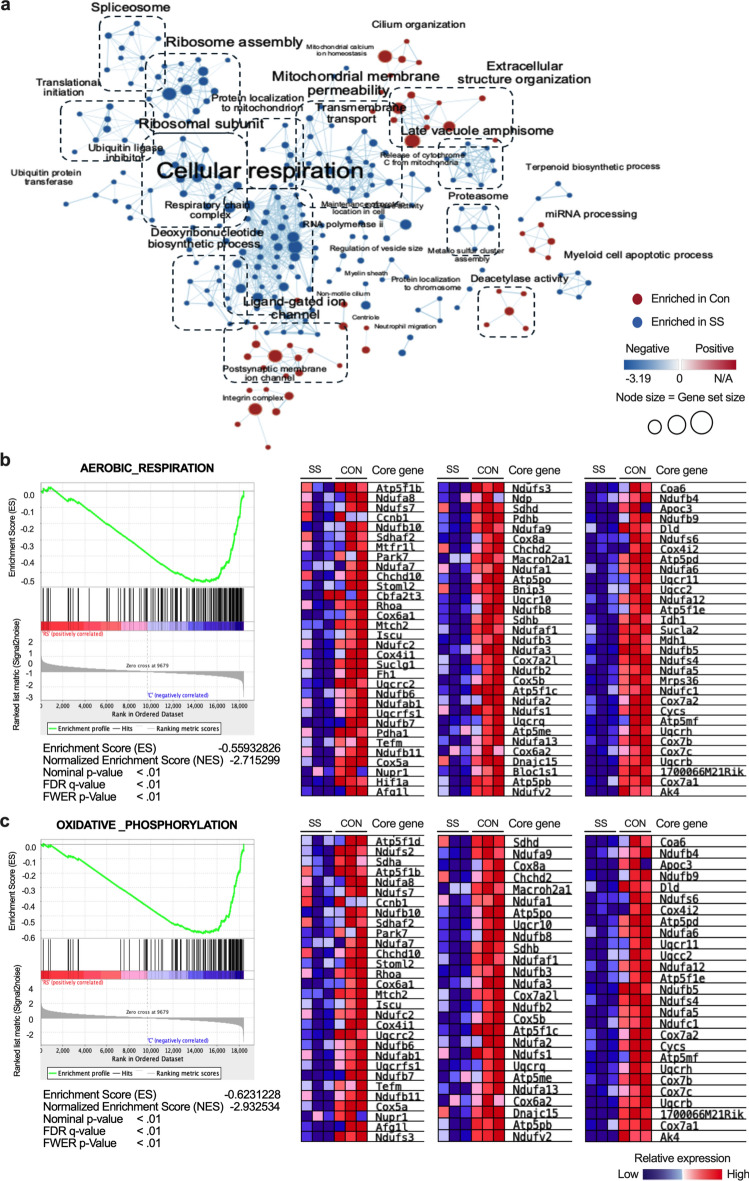
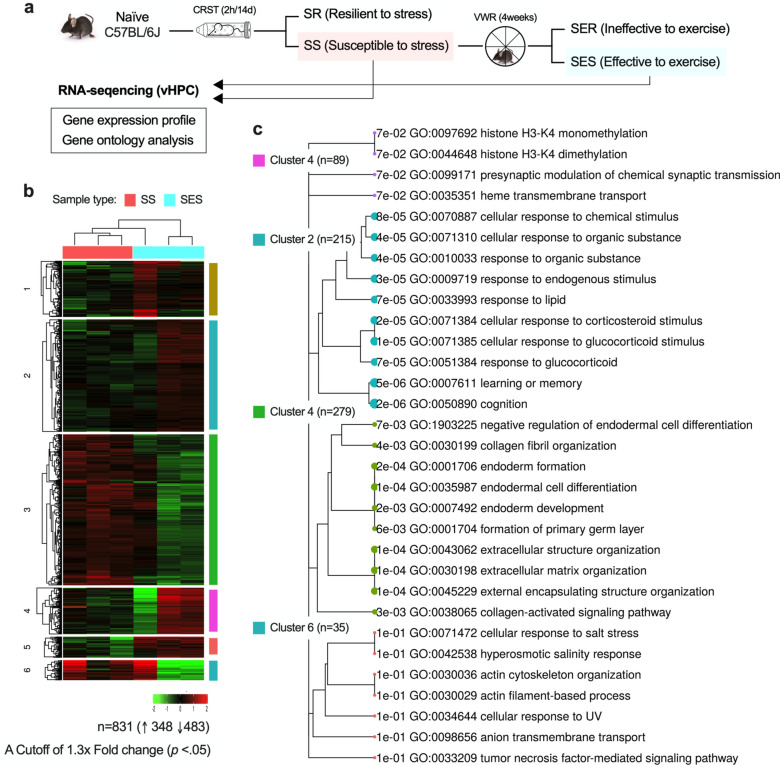
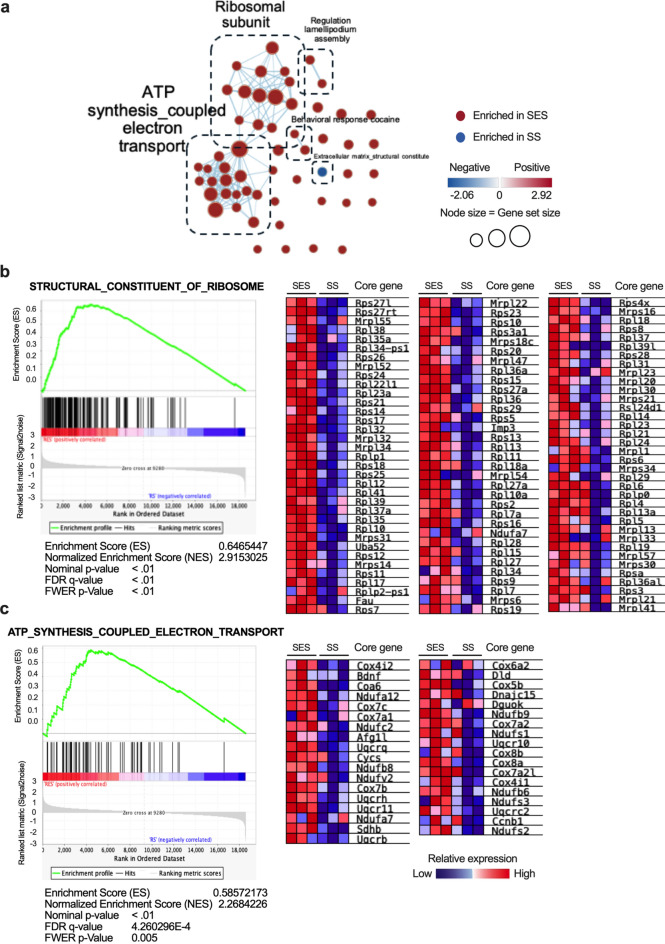
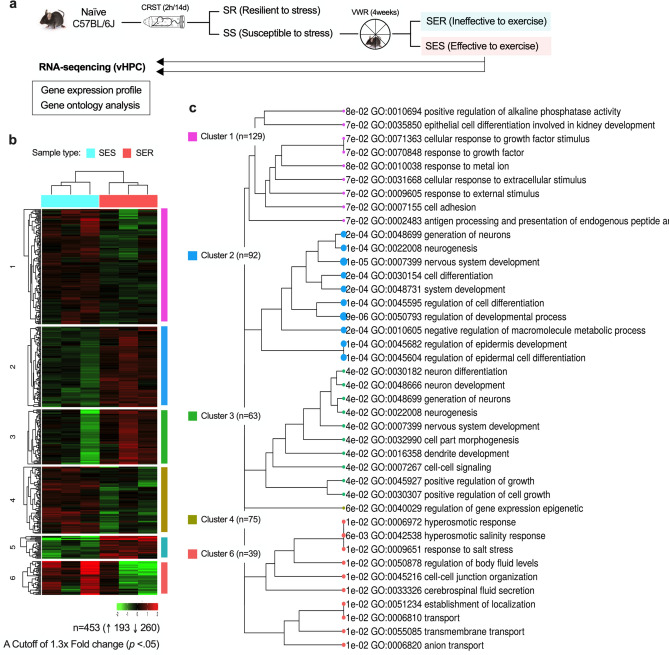
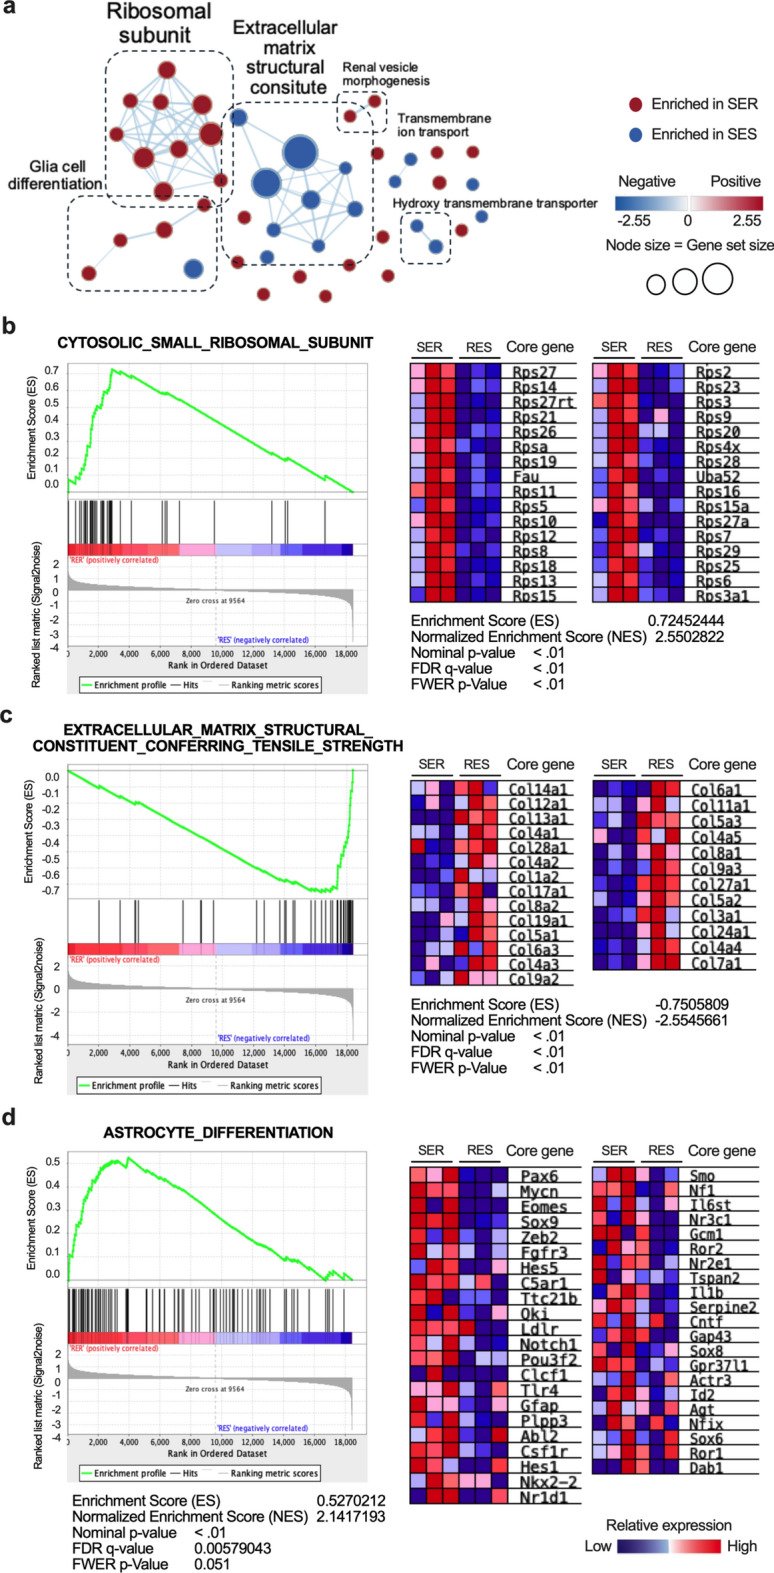
Stress susceptibility varies across individuals, influenced by genetic, molecular, and environmental factors. Hence, approaches for exercise treatment as an antidepressant and anxiolytic intervention must consider individual variability. Examining individual adaptation to exercise provides insights into the biology of such variations. We investigated the efficacy of voluntary wheel running (VWR) exercise as a disease-modifying treatment for stress-susceptible (SS) mice subjected to chronic restraint stress. A multidimensional behavior analysis revealed significant variability in VWR efficacy among individuals; while some mice showed substantial behavior phenotypic improvements (SES), others displayed limited/no benefits (SER). A transcriptomic profiling of the ventral hippocampus, a brain region critical to emotional regulation, revealed molecular signatures that promote adaptive changes by restoring cellular repair, energy availability, and synaptic plasticity in SS mice. SER mice exhibited limited behavior resilience and distinct transcriptomic profiles enriched in structural adaptation without functional resilience and glial cell differentiation marked by astrocyte activation or differentiation. These findings suggest that while VWR can mitigates multiple behavior symptoms in stress-susceptible mice, its effectiveness is modulated by distinct biological mechanisms. We highlight the importance of a multivariate framework for behavior assessment and genetic underpinnings, clarifying the variability in responses to stress and exercise's therapeutic efficacy in stress-related disorders.

Keywords: Anxiety; Depression; Exercise; Resilience; Stress; Susceptibility.


Conflict of interest statement

Declarations. Competing interests: The authors declare no competing interests.

Figures

Fig. 1
Fig. 1
Behavioral characterization and clustering of susceptibility and resilience to stress in mice subjected to CRST. (a) Schematic diagram of the experimental design. (bc) Immobility time in TST and FST for the indicated groups after exposure to CRST (n = 7 and 37 mice in Con and CRST groups). (d) K-means clustering of individual mice treated with CRST in the TST x FST matrix plotting with z-scores and Proportion (%) of each group in the clusters (approximately 72.97% (27/37) for susceptible (SS, red) and 27.02% (10/37) for resilient mice to stress (SR, light gray). The individuals of SS mice outlined with a thick border represent those that are resilient to stress (SR). Data are presented as mean ± SEM. Each circle represents individual data points. *p < 0.05, **p < 0.01, ***p < 0.001 compared to Con group. Con, control; CRST, chronic restraint stress; TST, tail suspension test; FST, forced swim test.
Fig. 2
Fig. 2
Exercise-driven behavioral improvements and clustering-based identification of effective or ineffective responder to exercise in susceptible mice. (a) Schematic diagram of the experimental design. (bc) Immobility time in TST and FST for the indicated groups after exposure to CRST and VWR treatment (n = 7–17 mice in Con, SS, and SS/Ex groups). (d) K-means clustering of individual SS mice subjected with VWR in the TST x FST matrix plotting with z-scores. The individuals of SS mice outlined with a thick border in behavior matrices represent those that are ineffective response to stress (SER). (e and f) Time in center zone and the number of marbles buried in OFT and MBT for indicated groups after (n = 7–17 mice in Con, SS, and SS/Ex groups). (g) K-means clustering of individual SS mice treated with VWR in the OFT x MBT matrix plotting with z-scores. The individuals of SS mice outlined with a thick border in behavior matrices represent those that are ineffective response to stress (SER). (h) Proportion (%) of each group in multidimensional behavior matrices including TST, FST, OFT, and MBT for exercise adaptation. Each cluster indicated approximately 47.05% (8/17 in TST x FST matrix), 64.70% (11/17 in OFT x MBT matrix, 64.70% (11/17 in TST x OFT matrix), 82.35% (14/17 in TST x MBT matrix), 58.82% (11/17 in FST x OFT matrix), and 58.82% (11/17 in FST x MBT matrix) for effective responder to VWR (SES group, blue) (Supplementary Fig. 2). (i) Number of each group in multidimensional behavior matrices including TST, FST, OFT, and MBT for exercise adaptation. Effective response (blue) was determined based on improved antidepressant and anxiolytic properties across multiple behavioral paradigms. Individual mice meeting stringent criteria (≥ 4 favorable behavioral outcomes) were classified, with 47.05% identified as SES (n = 8) and 52.94% as SER (n = 9). The red asterisks (*) specifically mark SES mice across behavior variables, emphasizing their distinct behavioral patterns. Data are presented as mean ± SEM. Each circle represents individual data points. *p < 0.05, **p < 0.01, ***p < 0.001 compared to Con group, #p < 0.05, ##p < .0.01 compared to the SS group. Con, control; VWR, voluntary wheel running; TST, tail suspension test; FST, forced swim test; OFT, open field test; MBT, marble burying test.
Fig. 3
Fig. 3
Transcriptomic profiling and gene ontology analysis reveal distinct molecular pathways exclusively enriched in stress-susceptible mice. (a) Schematic diagram of the experimental design. (bd) Volcano plots representing RNA-seq results of Con versus SS, SS versus SES, and SES versus SER (n = 3 animals per group). The abscissa in the volcano plot is the log2 (fold change) value, and the ordinate is the –log10 (p-value). The red dots represent up-regulated genes, and the blue dots represent down-regulated genes. (e and f) Hierarchical clustering heatmap showing gene expression profiles whose expressions were changed, with a cutoff of 1.3 × fold change and p < 0.05 in the vHPC of Con and SS mice and histogram illustrating enriched gene ontology (GO) terms from an extended search of the iDEP database based on clustered genes (k = 6). The significance of GO term enrichment was determined using False Discovery Rate (FDR) values.
Fig. 4
Fig. 4
Integrative genomic profiling identifies divergent pathways enriched in stress-susceptible mice. (a) Gene set enrichment analysis (GSEA)-based enrichment map and functional network analysis in the vHPC of SS mice compared to Con mice. Nodes (circles) represent enriched pathways identified based on transcriptomic expression, which are colored in more intense shades of red (enriched in Con mice) or blue (enriched in SS mice) depending on the strength of enrichment scores. Edges connect pathways/nodes based on a similarity cutoff of 0.375. Descriptive annotation (dotted box within the map) to cluster grouped according to functional families are automatically indicated as a single cluster label. (b and c) Enrichment plots of significant gene set (aerobic respiration and oxidative phosphorylation) enriched in SS compared to Con. Heatmaps of the core genes constituting the leading-edge subsets within the gene sets are shown in panels b and c, respectively, in Con and SS mice (with blue indicating low expression and red indicating high expression). The green curves show the enrichment score and reflect the degree to which each gene (black vertical lines) is represented at the bottom of the ranked gene list. Normalized enrichment score (NES), normalized p-value, FDR q-value, and FWER p-value are shown for each gene set.
Fig. 5
Fig. 5
Transcriptomic profiling and gene ontology analysis reveal distinct molecular pathways exclusively enriched in SES mice. (a) Schematic diagram of the experimental design. (b and c) Hierarchical clustering heatmap showing gene expression profiles whose expressions were changed with a cutoff of 1.3 × fold change and P < 0.05 in the vHPC of SS and SES mice and histogram illustrating enriched gene ontology (GO) terms from an extended search of the iDEP database based on clustered genes (k = 6). The significance of GO term enrichment was determined using False Discovery Rate (FDR) values.
Fig. 6
Fig. 6
Integrative genomic profiling identifies divergent pathways enriched in stress-susceptible mice. (a) Gene set enrichment analysis (GSEA)-based enrichment map and functional network analysis in the vHPC of SES mice compared to SS mice. Nodes (circles) represent enriched pathways identified based on transcriptomic expression, which are colored in more intense shades of red (enriched in SES mice) or blue (enriched in SS mice), depending on the strength of enrichment scores. Edges connect pathways/nodes based on a similarity cutoff of 0.375. Descriptive annotation (dotted box within the map) to cluster grouped according to functional families are automatically indicated as a single cluster label. (bc) Enrichment plots of significant gene set (structural constitute of ribosome and ATP synthesis coupled electron transport) enriched in SES compared to SS. Heatmaps of the core genes constituting the leading-edge subsets within the gene sets shown in panels b and c, respectively, in SS and SES mice (with blue indicating low expression and red indicating high expression). The green curves show the enrichment score and reflect the degree to which each gene (black vertical lines) is represented at the bottom of the ranked gene list. Normalized enrichment score (NES), normalized p-value, FDR q-value, and FWER p-value are shown for each gene set.
Fig. 7
Fig. 7
Transcriptomic profiling and gene ontology analysis reveal distinct molecular pathways exclusively enriched in SES mice. (a) Schematic diagram of the experimental design. (bc) Hierarchical clustering heatmap showing gene expression profiles whose expressions were changed with a cutoff of 1.3 × fold change and p < 0.05 in the vHPC of SES and SER mice and histogram illustrating enriched gene ontology (GO) terms from an extended search of the iDEP database based on clustered genes (k = 6). The significance of GO term enrichment was determined using False Discovery Rate (FDR) values.
Fig. 8
Fig. 8
Integrative genomic profiling identifies divergent pathways enriched in stress-susceptible mice. (a) Gene set enrichment analysis (GSEA)-based enrichment map and functional network analysis in the vHPC of SER mice compared to SES mice. Nodes (circles) represent enriched pathways identified based on transcriptomic expression, which are colored in more intense shades of red (enriched in SER mice) or blue (enriched in SES mice) depending on the strength of enrichment scores. Edges connect pathways/nodes based on a similarity cutoff of 0.375. Descriptive annotation to cluster (dotted box within the map) grouped according to functional families are automatically indicated as a single cluster label. (bd) Enrichment plots of significant gene set (cytosolic small ribosomal subunit and astrocyte differentiation) enriched in SER and (extracellular matrix structural constituent conferring tensile strength) in SES. Heatmaps of the core genes constituting the leading-edge subsets within the gene are sets shown in panels b, c, and d, respectively, in SES and SER mice (with blue indicating low expression and red indicating high expression). The green curves show the enrichment score and reflect the degree to which each gene (black vertical lines) is represented at the bottom of the ranked gene list. Normalized enrichment score (NES), normalized p-value, FDR q-value, and FWER p-value are shown for each gene set.

Similar articles

References

    1. Krishnan, V. et al. Molecular adaptations underlying susceptibility and resistance to social defeat in brain reward regions. Cell131, 391–404 (2007). - PubMed
    1. Ebner, K. & Singewald, N. Individual differences in stress susceptibility and stress inhibitory mechanisms. Curr. Opin. Behav. Sci.14, 54–64 (2017).
    1. Akil, H. & Nestler, E. J. The neurobiology of stress: Vulnerability, resilience, and major depression. Proc Natl Acad Sci USA120, e2312662120 (2023). - PMC - PubMed
    1. Verbitsky, A., Dopfel, D. & Zhang, N. Rodent models of post-traumatic stress disorder: behavioral assessment. Transl Psychiatry.10, 132 (2020). - PMC - PubMed
    1. Planchez, B., Surget, A. & Belzung, C. Animal models of major depression: Drawbacks and challenges. J. Neural Transm (Vienna).126, 1383–1408 (2019). - PMC - PubMed

LinkOut - more resources