. 2025 Apr 28;15(1):14761.
doi: 10.1038/s41598-025-98126-5.

Histomorphometric and microtomographic evaluation of hydroxyapatite coated implants and L-PRF in over drilled bone sites in sheep

Affiliations

Histomorphometric and microtomographic evaluation of hydroxyapatite coated implants and L-PRF in over drilled bone sites in sheep

Sylvio Luiz Costa De-Moraes et al. Sci Rep. .

Abstract

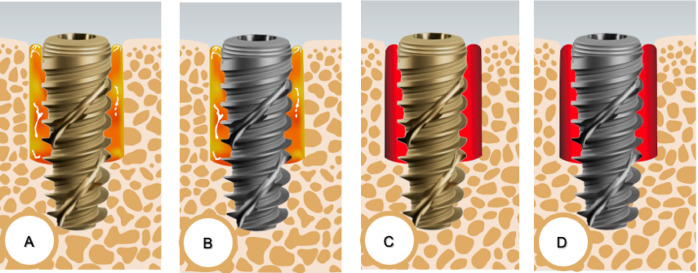
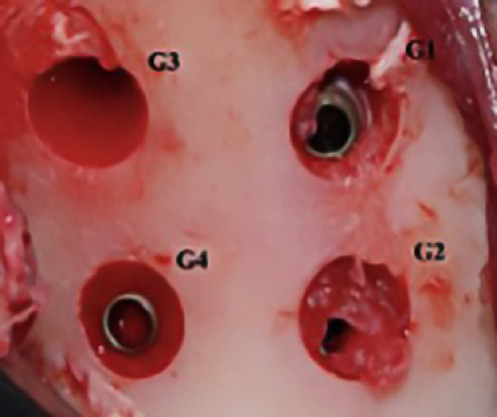
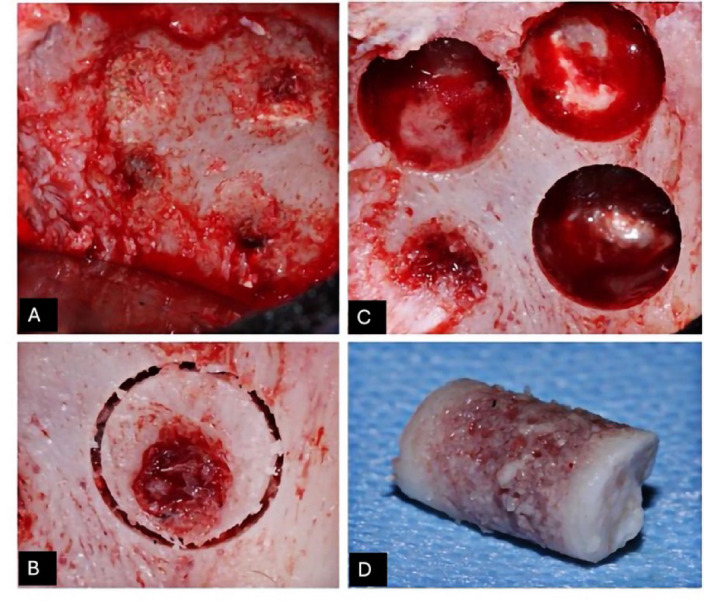
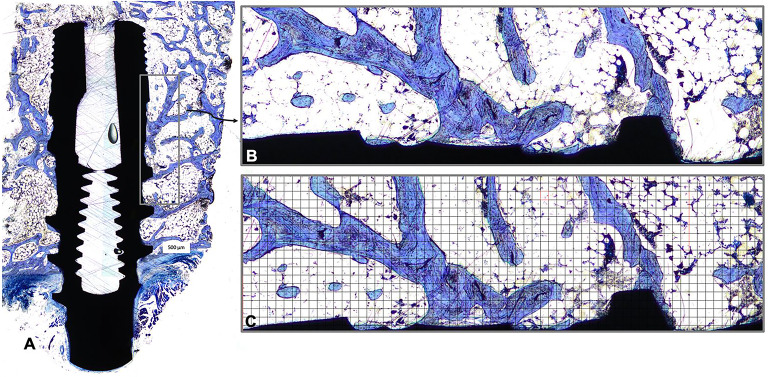
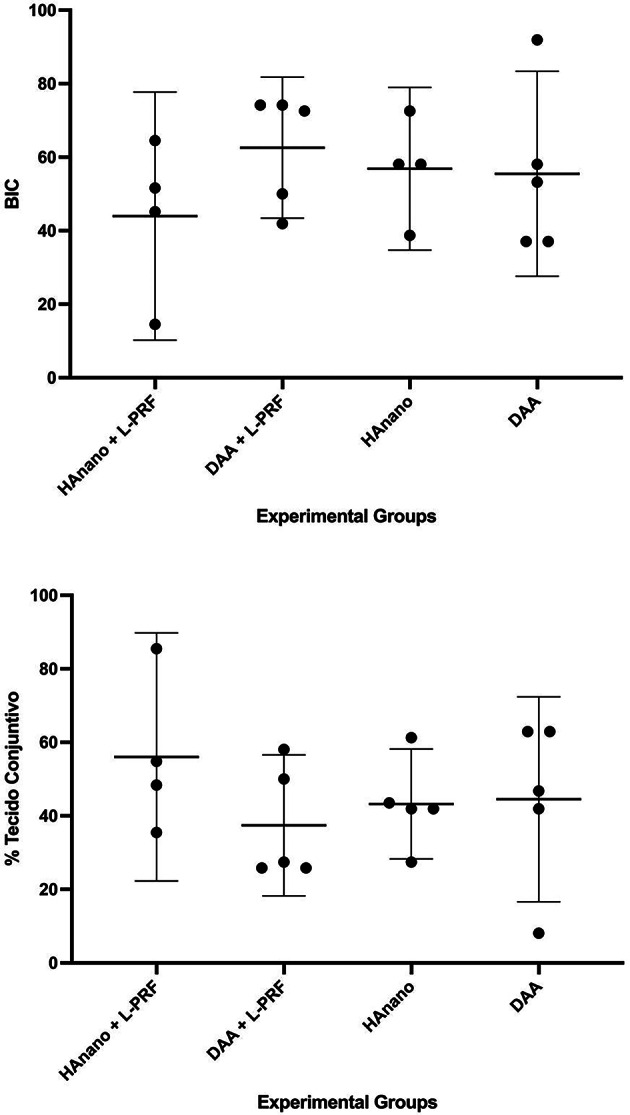
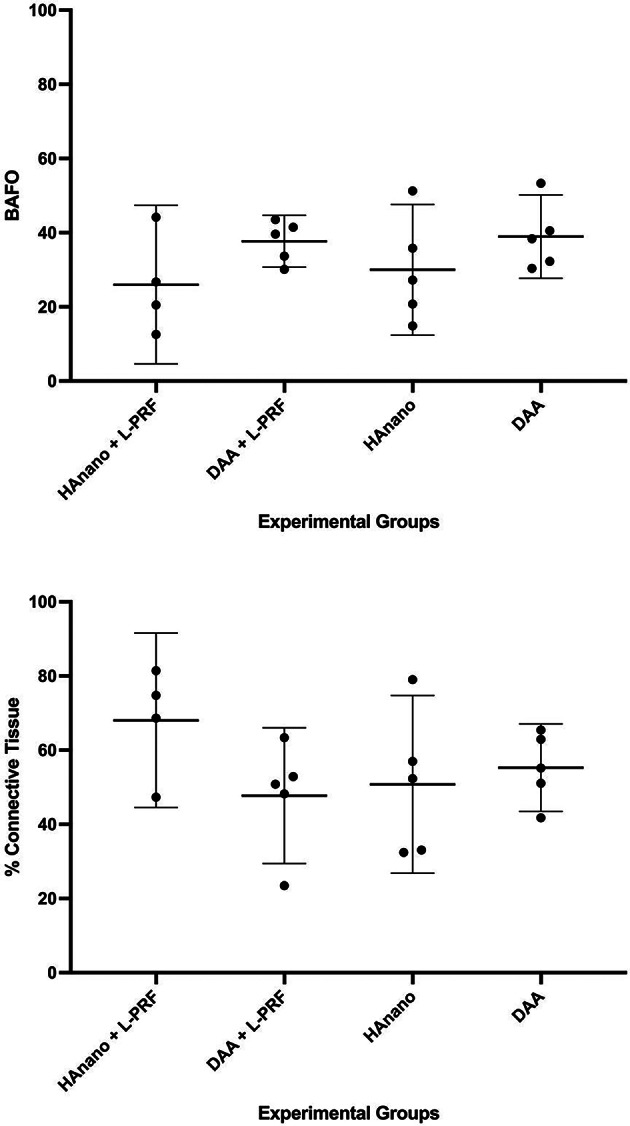
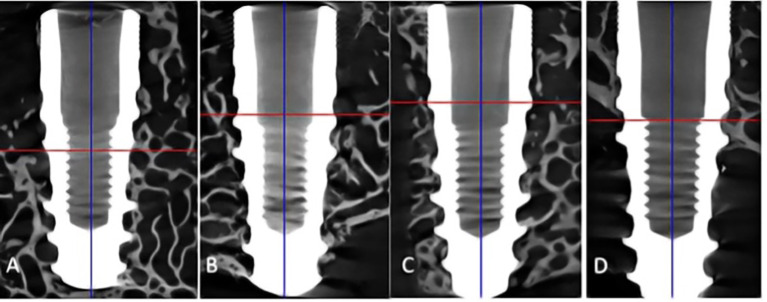
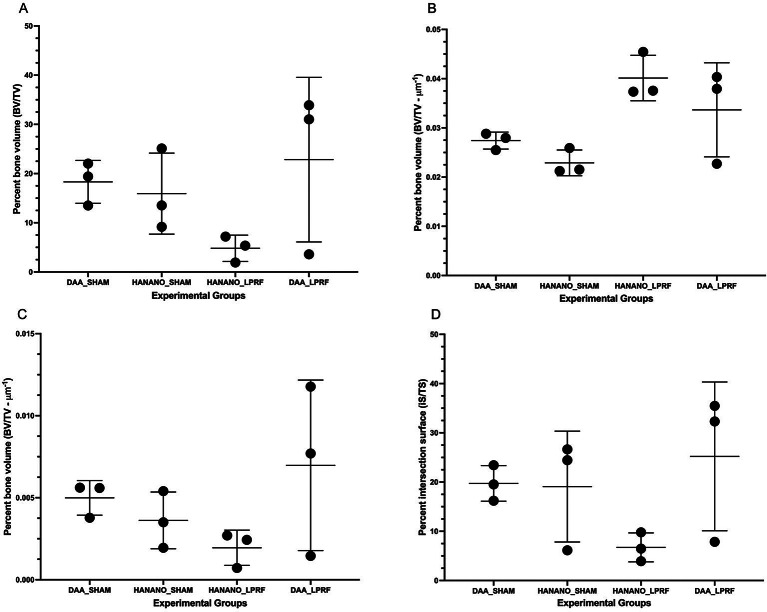
Hydroxyapatite used as a coating for titanium dental implants reduces the time required for osseointegration. Platelet-rich fibrin (L-PRF) releases growth factors and cytokines, enhancing tissue healing and bone regeneration. This study aimed to evaluate histologically, histomorphometrically, and by microcomputed tomography an implant surface coated with nanostructured hydroxyapatite (HAnano), in comparison with a double acid-etched (DAA) surface, both with and without peri-implant grafting with L-PRF, installed in over-instrumented sites in a low-density bone. Five adult sheep (2-4 years old) received twenty 3.5 × 10 mm implants in the iliac crest. Bone-to-implant contact (BIC) and bone-occupied area fraction (BAFo) were evaluated histomorphometrically after an 8-week experimental period. Brown-Forsyth analysis of variance (ANOVA) and Welch's ANOVA test did not identify significant differences between the experimental groups. On average, BIC ranged from 44% (HAnano + L-PRF) to 63% (DAA + L-PRF). µCT analysis revealed that bone volume density in the peri-implant region ranged from 26% (HAnano + L-PRF) to 39% (DAA). No statistically significant differences were observed between the groups. Both implant surfaces studied allowed osseointegration in low bone density sites, independently of peri-implant grafting with L-PRF, after 8 weeks of implantation. While this model provided controlled conditions for evaluating early-stage osseointegration, the absence of functional loading and the relatively short follow-up period should be considered when extrapolating the findings to clinical applications. Future studies should assess these variables under load-bearing conditions with extended observation periods. All the sheep in this study remained alive.

Keywords: Double acid attack; Hydroxyapatite; Osseointegration; Sheep, L-PRF; Titanium dental implants.


Conflict of interest statement

Declarations. Competing interests: The authors declare no competing interests.

Figures

Fig. 1
Fig. 1
Overview of implant placement and peri-implant biomaterial distribution across experimental groups (n = 5 per group, total = 20 implants): (A) Epikut Plus® (HAnano) in an L-PRF-filled site (Group 1); (B) Epikut® (DAA) in an L-PRF-filled site (Group 2); (C) Epikut Plus® (HAnano) in a blood-filled site (Group 3); (D) Epikut® (DAA) in a blood-filled site (Group 4). This figure illustrates implant surface variations and peri-implant grafting conditions. The image was kindly provided by Dr. Helder Valiense and created using CorelDRAW, version 21.
Fig. 2
Fig. 2
Surgical procedure for implant placement in the iliac crest. The image illustrates incision, bone exposure, and implant positioning, following the experimental protocol for peri-implant biomaterial placement.
Fig. 3
Fig. 3
Sample collection process for histological and histomorphometric analysis, performed eight weeks after implantation. (A) Iliac crest showing bone repair at the implant site; (B) Marking of the trephination site for bone block extraction; (C) Bone blocks containing implants retrieved for histological evaluation; (D) Bone block with implant and peri-implant tissue, prepared for analysis.
Fig. 4
Fig. 4
Histomorphometric method for evaluating bone-implant contact (BIC) and bone area fraction occupancy (BAFo). (A) Histological reconstruction of the implant and peri-implant tissues; (B) Delineation of the area of interest (36 μm × 10 μm), spanning the first to fourth implant threads; (C) Grid overlay with 18 vertical and 62 horizontal equidistant lines for quantitative analysis. Staining: Toluidine blue. Scale bar: 500 μm. This method provides a detailed assessment of the implant-bone interface.
Fig. 5
Fig. 5
Image ProPlus software interface is used to classify grid intersections into new bone, biomaterial, or connective tissue, enabling BAFo quantification. The image illustrates the software’s role in data processing and its application in evaluating peri-implant material integration.
Fig. 6
Fig. 6
Photomicrographs of the peri-implant region eight weeks post-implantation. (A) HAnano + L-PRF, (B) DAA + L-PRF, (C) HAnano + Blood (Sham), (D) DAA + Blood (Sham Group). Red arrows highlight bone-implant contact (BIC) areas. Staining: Toluidine blue. Magnification: 20x; Scale bar: 100 μm. The images show newly formed bone trabeculae across different treatment groups.
Fig. 7
Fig. 7
Bone-implant contact (BIC) and connective tissue (TC) percentages in experimental groups (HAnano + L-PRF, DAA + L-PRF, HAnano Sham, DAA Sham). Histomorphometric analysis showed no significant differences (Brown-Forsythe and Welch ANOVA, p > 0.05). BIC ranged from 44–63%, while connective tissue surface ranged from 37–56%. Data are presented as mean ± 95% confidence intervals.
Fig. 8
Fig. 8
Comparative analysis of bone volume density (BAFo) and connective tissue (TC) percentages in the peri-implant region across experimental groups. No significant differences were observed (Brown-Forsythe and Welch ANOVA, p > 0.05). BAFo ranged from 26–39%, while connective tissue density varied between 48% and 68%. Data are presented as mean ± 95% confidence intervals.
Fig. 9
Fig. 9
Microtomographic images of the experimental groups. (A) HAnano + Blood (Sham); (B) HAnano + L-PRF; (C) DAA + Blood (Sham) and (D) DAA + L-PRF).
Fig. 10
Fig. 10
Microtomographic analysis of bone structures across experimental groups (DAA_SHAM, HANANO_SHAM, HANANO_LPRF, and DAA_LPRF), evaluating bone volume percentage (BV/TV), bone surface-to-volume ratio (BS/BV), bone surface density (BS/TV), and surface intersection percentage (iS/TS). Data are presented as mean ± standard deviation. Statistical analysis was performed using the Kruskal-Wallis test followed by Dunn’s post-test, revealing no significant differences between groups (p > 0.05; n = 3).

Similar articles

References

    1. Klein, M. O. et al. Al- Nawas, B. Submicron scale-structured hydrophilic titanium surfaces promote early osteogenic gene response for cell adhesion and cell differentiation. Clin. Implant Dent. Relat. Res.15, 166–175 (2013). - PubMed
    1. Wennerberg, A. & Albrektsson, T. Effects of titanium surface topography on bone integration: a systematic review. Clin. Oral. Implants. Res.20, 172–184 (2009). - PubMed
    1. Elias, C. N. & Meirelles, L. Improving osseointegration of dental implants. Expert Rev. Med. Dev.7, 241–256 (2010). - PubMed
    1. Sartoretto, S. C. et al. Early osseointegration driven by the surface chemistry and wettability Od dental implants. J. Appl. Oral Sci.23 (3), 279–287 (2015). - PMC - PubMed
    1. Sartoretto, S. C. et al. Hydrophilic surface of Ti6Al4V-ELI alloy improves the early bone apposition of sheep tibia. Clin. Oral Implant Res.28 (8), 893–901 (2016). - PubMed

LinkOut - more resources