

Machine learning-based quantification and separation of emissions and meteorological effects on PM2.5 in Greater Bangkok
- PMID: 40295616
- PMCID: PMC12038008
- DOI: 10.1038/s41598-025-99094-6
Machine learning-based quantification and separation of emissions and meteorological effects on PM2.5 in Greater Bangkok
Abstract
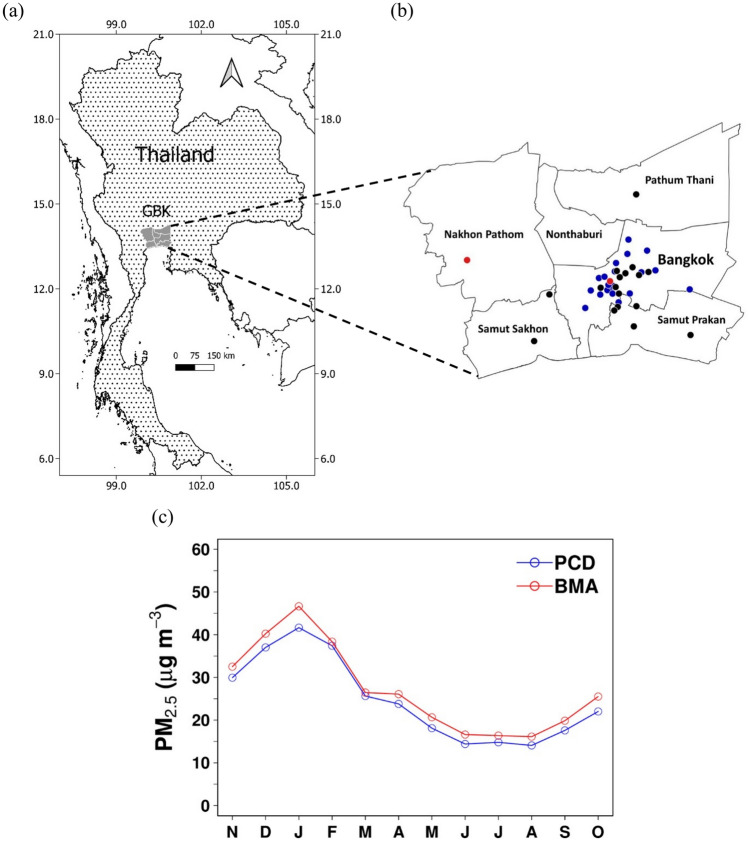
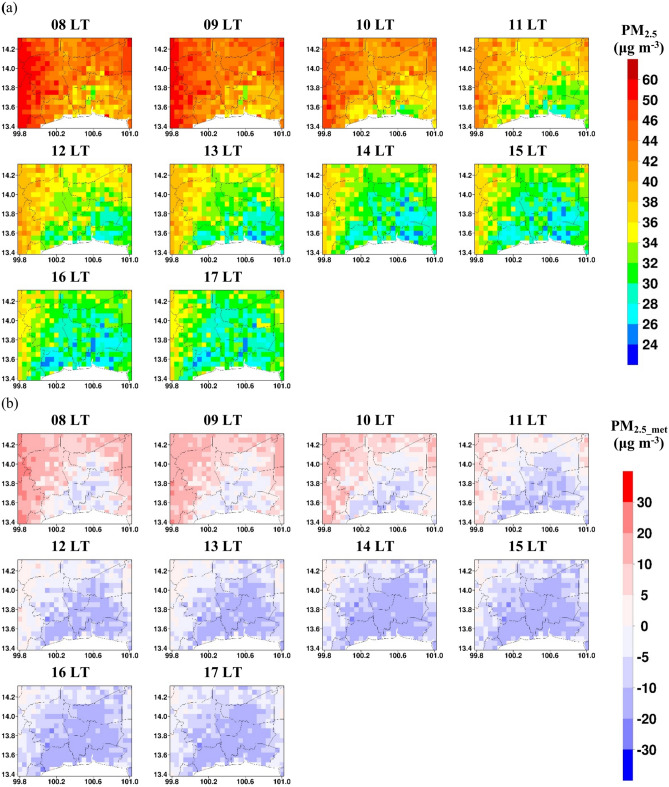
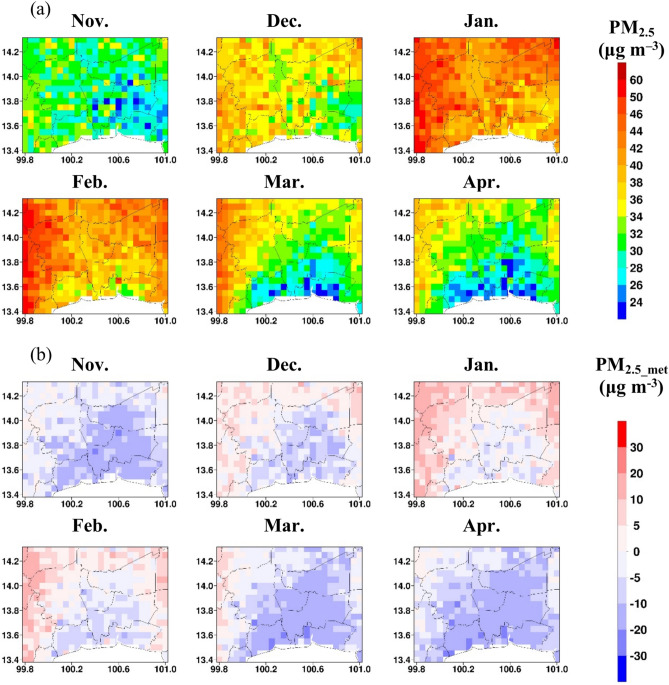
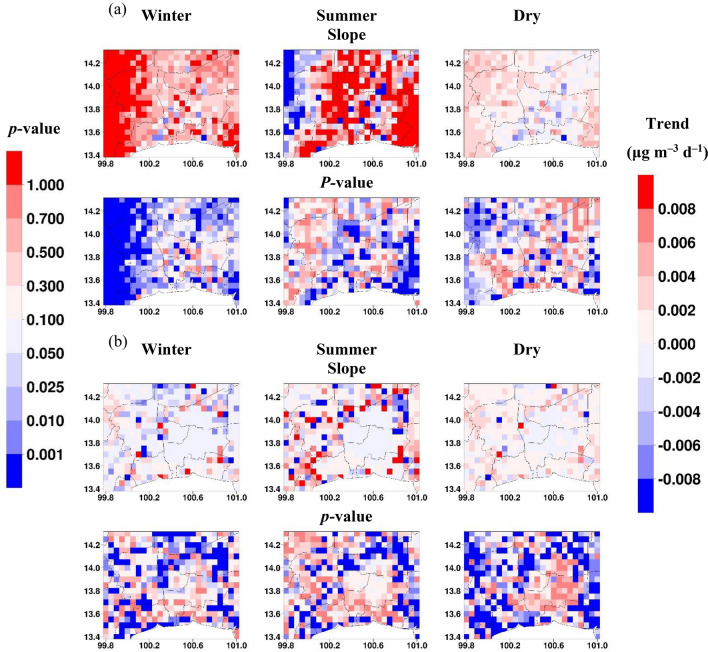
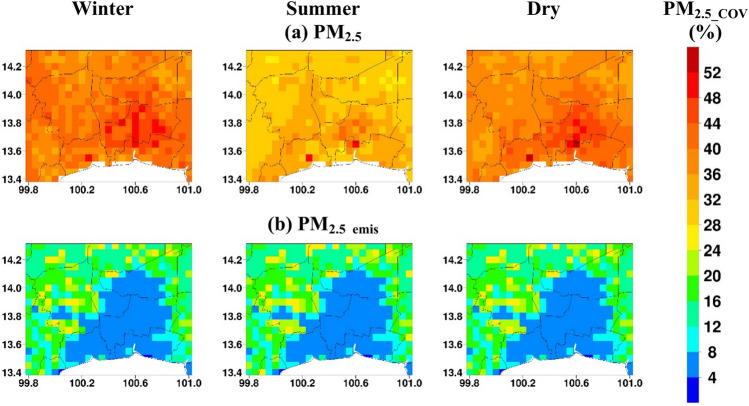
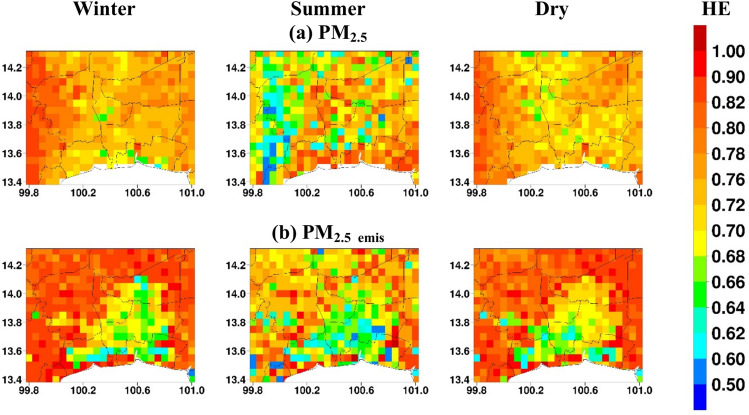
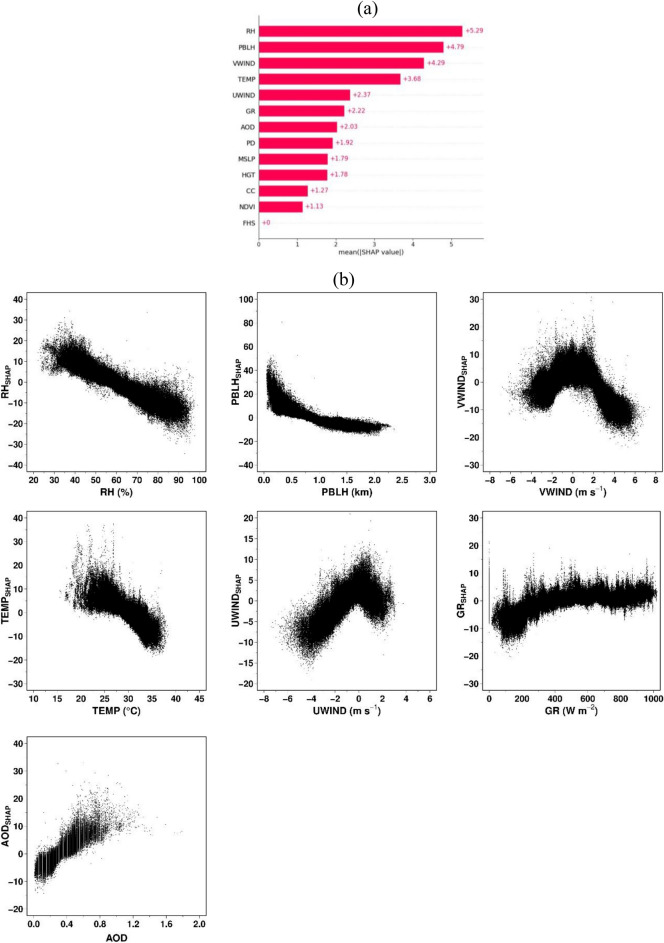
This study presents the first-ever application of machine learning (ML)-based meteorological normalization and Shapley additive explanations (SHAP) analysis to quantify, separate, and understand the effect of meteorology on PM2.5 over Greater Bangkok (GBK). Six ML models namely random forest (RF), adaptive boosting (ADB), gradient boosting (GB), extreme gradient boosting (XGB), light gradient boosting machine (LGBM), and cat boosting (CB) were used with meteorological factors, fire activity, land use, and socio-economic data as predictor variables. The LGBM outperformed other models achieving ρ = 0.9 (0.95), MBE = 0 (- 0.01), MAE = 5.5 (3.3) μg m-3, and RMSE = 8.7 (4.9) μg m-3 for hourly (daily) PM2.5 prediction. LGBM was used for spatiotemporal PM2.5 estimation, and meteorological normalization was applied to calculate PM2.5_emis (emission-related PM2.5) and PM2.5_met (meteorology-related PM2.5). Diurnal variation reveals higher PM2.5 levels in the morning (08-10 LT) due to increased traffic emissions and thermal inversion and a decrease in PM2.5 as the day progresses due to decreased emission and inversion dissipation. Monthly variation suggests higher PM2.5 in winter (December and January) due to emissions and stagnant meteorological conditions. Negative PM2.5_met during November, March, and April values show meteorology improves air quality, while positive values from December to February indicate stagnant winter conditions worsen it. During winter, PM2.5_emis and PM2.5 showed an increasing trend in 15.6% and 67.8% of the area while decreasing trends fell from 23.2 to 1.9%. In summer, the percentage of areas with an increasing trend rose from 18.7 to 34.6%, and decreasing areas fell from 12.6 to 6.5%. Increase in PM2.5 despite decreasing emission over a larger area, indicating limited effectiveness of mitigation measures. Winter exhibits greater PM2.5 variability due to episodic increases from changing meteorological conditions. In Bangkok and nearby areas, higher variability is mainly driven by meteorology, with more consistent emissions in Bangkok compared to rural areas affected by agricultural burning. PM2.5 and PM2.5_emis showed stronger persistence in winter than in summer, with weaker effects in Bangkok. Hurst exponent averages were 0.75, 0.76, and 0.72 for PM2.5 and 0.79, 0.8, and 0.73 for PM2.5_emis in dry, winter, and summer seasons, respectively. SHAP analysis suggested relative humidity, planetary boundary layer height, v wind, temperature, u wind, global radiation, and aerosol optical depth as the key variables affecting PM2.5 with mean absolute SHAP values of 5.29, 4.79, 4.29, 3.68, 2.37, 2.22, and 2.03, respectively. Based on these findings, some policy recommendations have been proposed.
Keywords: Explainable machine learning; Himawari-8; Hurst exponent; Meteorological normalization; PM2.5 mapping; SHAP.
© 2025. The Author(s).
Conflict of interest statement
Declarations. Competing interests: The authors declare no competing interests.
Figures
Similar articles
-
Slower than expected reduction in annual PM2.5 in Xi'an revealed by machine learning-based meteorological normalization.Sci Total Environ. 2022 Oct 1;841:156740. doi: 10.1016/j.scitotenv.2022.156740. Epub 2022 Jun 16. Sci Total Environ. 2022. PMID: 35716759
-
Estimating visibility and understanding factors influencing its variations at Bangkok airport using machine learning and a game theory-based approach.Environ Sci Pollut Res Int. 2024 Aug 5. doi: 10.1007/s11356-024-34548-4. Online ahead of print. Environ Sci Pollut Res Int. 2024. PMID: 39102136
-
Seasonal prediction of daily PM2.5 concentrations with interpretable machine learning: a case study of Beijing, China.Environ Sci Pollut Res Int. 2022 Jun;29(30):45821-45836. doi: 10.1007/s11356-022-18913-9. Epub 2022 Feb 12. Environ Sci Pollut Res Int. 2022. PMID: 35150424
-
Evolution of Urban Haze in Greater Bangkok and Association with Local Meteorological and Synoptic Characteristics during Two Recent Haze Episodes.Int J Environ Res Public Health. 2020 Dec 18;17(24):9499. doi: 10.3390/ijerph17249499. Int J Environ Res Public Health. 2020. PMID: 33352994 Free PMC article.
-
A study on the impact of meteorological and emission factors on PM2.5 concentrations based on machine learning.J Environ Manage. 2025 Mar;376:124347. doi: 10.1016/j.jenvman.2025.124347. Epub 2025 Feb 15. J Environ Manage. 2025. PMID: 39951999
References
-
- Lelieveld, J., Evans, J., Fnais, M., Giannadaki, D. & Pozzer, A. The contribution of outdoor air pollution sources to premature mortality on a global scale. Nature525, 367–371. 10.1038/nature15371 (2015). - PubMed
-
- Pollution Control Department (PCD) (2024) Annual Report 2023, Pollution Control Department, Bangkok, Thailand (in Thai). https://www.pcd.go.th/wp-content/uploads/2024/06/pcdnew-2024-06-27_07-41... (accessed on 6th September 2024).
-
- ChooChuay, C. et al. Impacts of PM2.5 sources on variations in particulate chemical compounds in ambient air of Bangkok, Thailand. Atmos. Pollut. Res.11, 1657–1667. 10.1016/j.apr.2020.06.030 (2020).
MeSH terms
Substances
Grants and funding
LinkOut - more resources
Full Text Sources
Medical
Miscellaneous
