

Identification and quantification of muscular cocontraction for ankle rehabilitation through variational mode decomposition in surface electromyography
- PMID: 40295627
- PMCID: PMC12037877
- DOI: 10.1038/s41598-025-96334-7
Identification and quantification of muscular cocontraction for ankle rehabilitation through variational mode decomposition in surface electromyography
Abstract
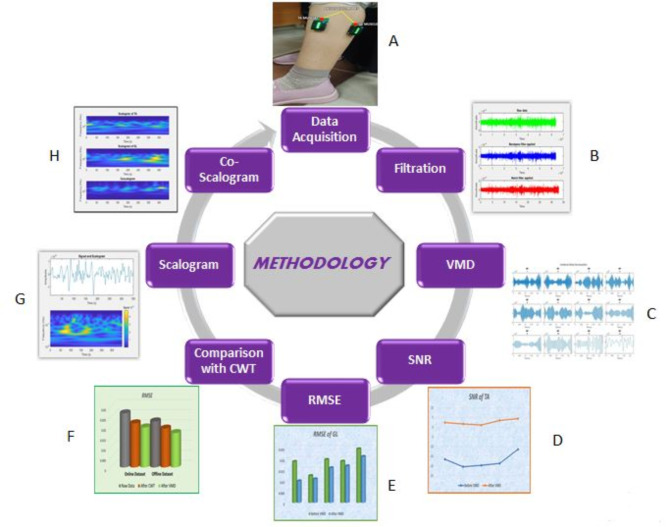
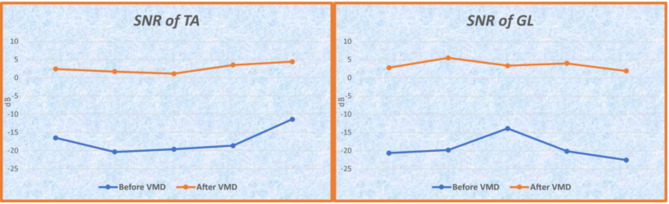
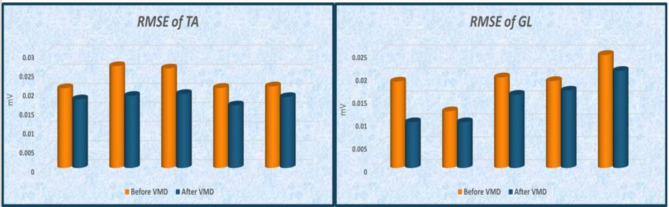
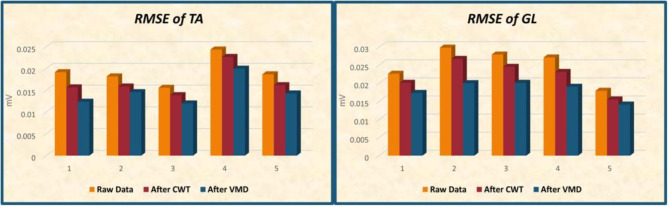
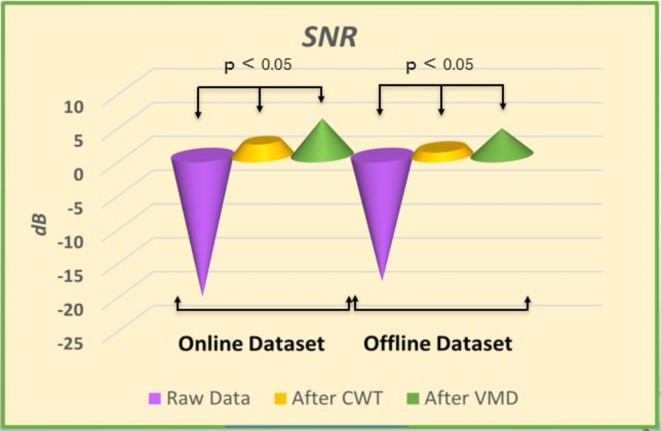
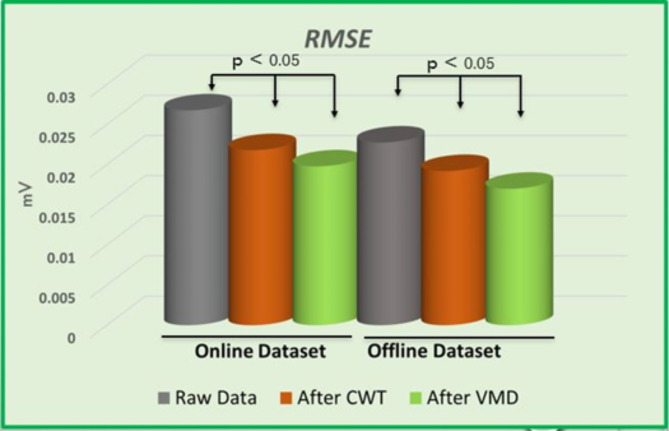
The ankle joint plays important role in performing fundamental activities such as walking and other essential daily tasks. Ankle stabilization and muscle co-contraction are crucial for rehabilitating gait abnormalities, as impaired ankle function disrupts gait, causes pain and inflammation, and hampers recovery. Accurate assessment of muscle co-contraction is crucial for developing effective non-pharmacological interventions. This paper introduces a novel approach using Variational Mode Decomposition (VMD) combined with scalogram visualization technique to analyze surface electromyographic (sEMG) signals from antagonist muscles of the lower limb and assesses muscular co-contraction using the coscalogram function. The present study compares VMD with the Continuous Wavelet Transform (CWT) approach and shows that VMD outperforms CWT in terms of both SNR and RMSE. On average, the increase in SNR in case of VMD (-17.65 ± 8.1dB to 2.98 ± 2.2dB) was greater than that of CWT (-17.65 ± 3.7dB to 1.34 ± 1.5dB). Similarly, the reduction in RMSE with VMD (0.023 ± 0.0029 to 0.017 ± 0.0015) surpassed that achieved with CWT (0.023 ± 0.0027 to 0.020 ± 0.0025). This enhanced accuracy in identifying co-contraction events has the potential to significantly improve clinical assessment and rehabilitation strategies for patients with ankle joint pathologies. To further validate VMD's effectiveness, we quantitatively assessed co-contraction events by comparing mean peak amplitudes identified using VMD and CWT. Our analysis, which revealed that VMD consistently captured stronger co-contraction events (higher mean peak amplitudes), supports VMD's superiority in accurately identifying and quantifying ankle muscle co-contraction. These results have significant implications for clinical practice, offering the potential for more precise assessments of ankle joint function and the development of more targeted and effective rehabilitation interventions.
Keywords: Ankle rehabilitation; Co-contraction; Continuous wavelet transform; Scalogram; Variational mode decomposition; sEMG.
© 2025. The Author(s).
Conflict of interest statement
Declarations. Competing interests: The authors declare no competing interests.
Figures


Similar articles
-
Muscle Co-Contraction Detection in the Time-Frequency Domain.Sensors (Basel). 2022 Jun 28;22(13):4886. doi: 10.3390/s22134886. Sensors (Basel). 2022. PMID: 35808382 Free PMC article.
-
Assessment of the ankle muscle co-contraction during normal gait: a surface electromyography study.J Electromyogr Kinesiol. 2015 Apr;25(2):347-54. doi: 10.1016/j.jelekin.2014.10.016. Epub 2014 Nov 7. J Electromyogr Kinesiol. 2015. PMID: 25465985
-
VMD-based denoising methods for surface electromyography signals.J Neural Eng. 2019 Aug 21;16(5):056017. doi: 10.1088/1741-2552/ab33e4. J Neural Eng. 2019. PMID: 31323653
-
Neural adaptations to resistive exercise: mechanisms and recommendations for training practices.Sports Med. 2006;36(2):133-49. doi: 10.2165/00007256-200636020-00004. Sports Med. 2006. PMID: 16464122 Review.
-
Contributions to the understanding of gait control.Dan Med J. 2014 Apr;61(4):B4823. Dan Med J. 2014. PMID: 24814597 Review.
References
-
- Zia ur Rehman, M. Z., Gilani, S. O., Waris, A., Niazi, I. K. & Kamavuako, E. N. A novel approach for classification of hand movements using surface EMG signals. in IEEE International Symposium on Signal Processing and Information Technology (ISSPIT) 265–269 (IEEE, 2017). (2017).
-
- Farina, D. & Negro, F. Accessing the neural drive to muscle and translation to neurorehabilitation technologies. IEEE Rev. Biomed. Eng.5, 3–14 (2012). - PubMed
-
- Corcos, D. M., Gottlieb, G. L., Penn, R. D., Myklebust, B. & Agarwal, G. C. Movement deficits caused by hyperexcitable stretch reflexes in spastic humans. Brain109, 1043–1058 (1986). - PubMed
MeSH terms
LinkOut - more resources
Full Text Sources
