

Elevated Fab glycosylation of autoantibodies maintained during B cell depletion therapy
- PMID: 40295683
- PMCID: PMC12037893
- DOI: 10.1038/s41598-025-99226-y
Elevated Fab glycosylation of autoantibodies maintained during B cell depletion therapy
Abstract
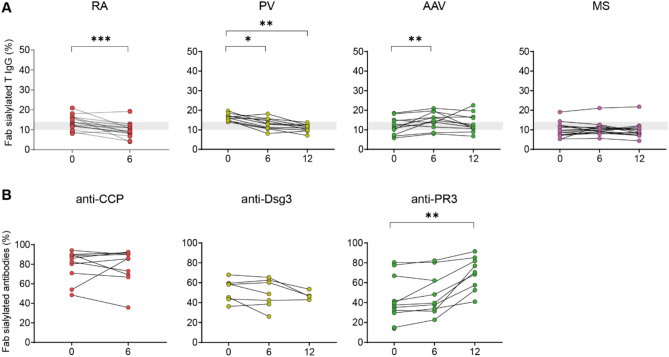
Several chronic autoimmune diseases are characterized by elevated autoantibody Fab glycosylation. Whether Fab glycans link to disease state or development remains unclear, yet may serve as a marker thereof. Many autoimmune diseases are treated with B cell depletion therapies that particularly result in a decline of autoantibodies. The question arises whether B cell depletion therapy may have an impact on Fab glycosylation. Here, we investigated the longitudinal effects of B cell depletion therapy on Fab glycosylation of total IgG and IgG autoantibodies in rheumatoid arthritis (RA), pemphigus vulgaris (PV), ANCA-associated vasculitis (AAV), and multiple sclerosis (MS). Baseline Fab glycosylation was compared to 6-12 months into therapy by lectin affinity chromatography, determining Fab sialylation as an estimate of Fab glycosylation. We observed a modest decrease in Fab glycosylation of total IgG for RA (median 13.8%[IQR 11.7-16.3] - 9.1%[IQR8-11]) and PV (16.4%[IQR14.9-17.5] - 13.01%[IQR10.8-15.5]) after 6 months, whereas for AAV Fab glycosylation slightly increased (11.6%[IQR7.4-15] - 14.9%[IQR11.4-19.3]), and no changes were found for MS. Autoantibody titers (anti-CCP, anti-PR3, anti-Dsg3) had declined following B cell depletion therapy, yet their elevated Fab glycosylation levels were maintained. Taken together, Fab glycosylation levels of autoantibodies do not decrease upon B cell depletion therapy, thereby retaining their predictive potential as biomarker.
Keywords: B cell depletion therapy; Changes in Fab glycosylation of total IgG compartment upon B cell depletion therapy in autoantibody-mediated chronic autoimmune diseases; Chronic autoimmunity; Fab glycosylation autoantibodies; High Fab glycosylation of autoantibodies maintained during B cell depletion therapy.
© 2025. The Author(s).
Conflict of interest statement
Declarations. Competing interests: JK received research grants for multicentre investigator-initiated trials DOT-MS (NCT04260711, ZonMW), Supernext (NCT04225312, Treatmeds) and BLOOMS (NCT05296161, ZonMW and Treatmeds); received consulting fees from F Hoffmann-La Roche, Biogen, Teva, Merck, Novartis, and Sanofi/Genzyme (all payments to institution); reports speaker relationships with F Hoffmann-La Roche, Biogen, Immunic, Teva, Merck, Novartis, and Sanofi/Genzyme (all payments to institution); and is on the adjudication committee of MS clinical trials of Immunic (payments to institution only). All other authors declare no competing interests.
Figures


References
-
- Dunn-Walters, D., Boursier, L. & Spencer, J. Effect of somatic hypermutation on potential N-glycosylation sites in human immunoglobulin heavy chain variable regions. Mol. Immunol.37, 107–113 (2000). - PubMed
-
- van de Bovenkamp, F. S., Hafkenscheid, L., Rispens, T. & Rombouts, Y. The Emerging Importance of IgG Fab Glycosylation in Immunity. J. Immunol.196, 1435–1441 (2016). - PubMed
-
- Vergroesen, R. D. et al. B-cell receptor sequencing of anti-citrullinated protein antibody (ACPA) IgG-expressing B cells indicates a selective advantage for the introduction of N -glycosylation sites during somatic hypermutation. Ann. Rheum. Dis.10.1136/annrheumdis-2017-212052 (2017). - PubMed
-
- Koers, J., Sciarrillo, R., Derksen, N. I. L. & Vletter, E. M. Differences in IgG autoantibody Fab glycosylation across autoimmune diseases. J. Allergy Clin. Immunol.151, 1646–1654 (2023). - PubMed
MeSH terms
Substances
Grants and funding
- LSHM18055-SGF/Samenwerkende Gezondheidsfondsen (SGF)
- LSHM18055-SGF/Samenwerkende Gezondheidsfondsen (SGF)
- LSHM18055-SGF/Samenwerkende Gezondheidsfondsen (SGF)
- LSHM18055-SGF/Samenwerkende Gezondheidsfondsen (SGF)
- LSHM18055-SGF/Samenwerkende Gezondheidsfondsen (SGF)
- LSHM18055-SGF/Samenwerkende Gezondheidsfondsen (SGF)
- LSHM18055-SGF/Samenwerkende Gezondheidsfondsen (SGF)
- LSHM18055-SGF/Samenwerkende Gezondheidsfondsen (SGF)
- LSHM18055-SGF/Samenwerkende Gezondheidsfondsen (SGF)
- LSHM18055-SGF/Samenwerkende Gezondheidsfondsen (SGF)
- LSHM18055-SGF/Samenwerkende Gezondheidsfondsen (SGF)
- LSHM18055-SGF/Samenwerkende Gezondheidsfondsen (SGF)
- Grant1626/Landsteiner Foundation for Blood Transfusion Research
LinkOut - more resources
Full Text Sources
Medical
Miscellaneous
