. 2024 Feb 14;2(1):7.
doi: 10.1038/s44298-024-00015-7.

Revealing the significance of IL-2 and IL-5 in SARS-CoV-2-specific T-cell responses in kidney transplant recipients

Collaborators, Affiliations

Revealing the significance of IL-2 and IL-5 in SARS-CoV-2-specific T-cell responses in kidney transplant recipients

Yvette den Hartog et al. Npj Viruses. .

Abstract

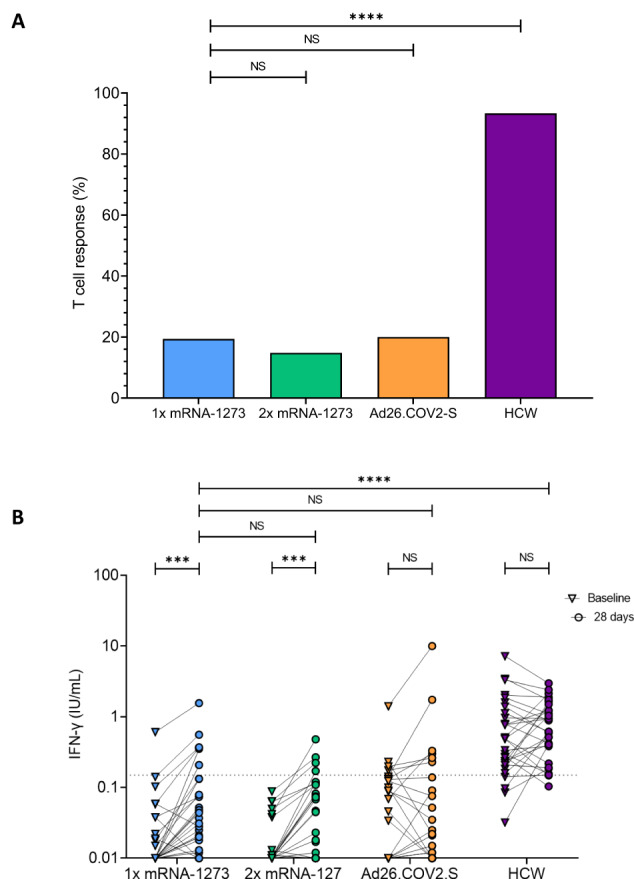
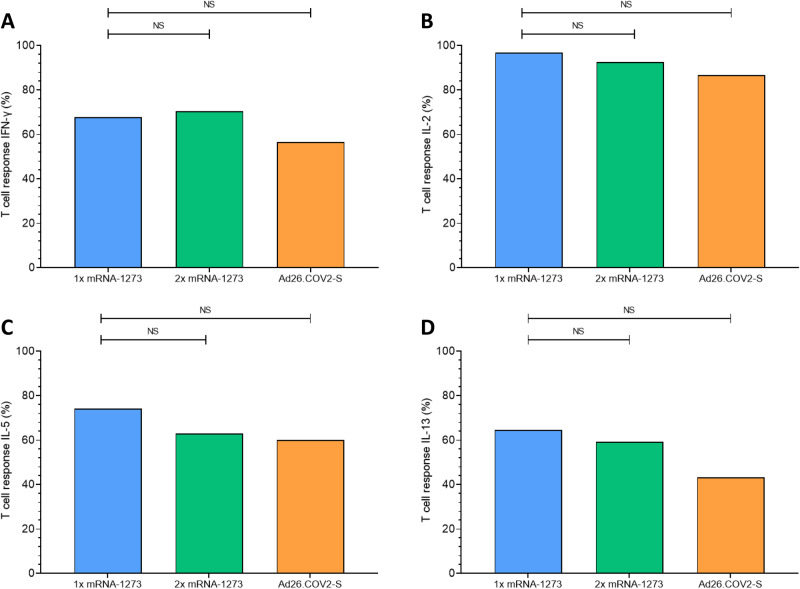
Kidney transplant recipients (KTRs) are at an increased risk of severe COVID-19 due to compromised immune responses. Although vaccination is critical in preventing severe disease, KTRs have attenuated vaccination-induced immune responses due to underlying kidney disease and immunosuppressive therapies. In this study, the effect of different COVID-19 booster strategies on SARS-CoV-2-specific T-cell responses was assessed in KTRs who showed a poor serological response after the first two mRNA-based primary vaccination doses. In these KTRs, a third vaccination dose led to an increase in antibody levels in the majority of patients. Production of IL-2 and IL-5 by SARS-CoV-2 specific T cells positively correlated with antibody levels, with stronger correlations compared to IFN-γ production, the 'traditional' cytokine to measure T-cell responses. Our study underscores the significance a balanced T-cell cytokine response to achieve robust antibody responses in KTRs. Furthermore, we show that multiple cytokines to assess T-cell responses should be explored to identify individuals in need of tailored vaccination strategies.


Conflict of interest statement

Competing interests: The authors declare no competing interests.

Figures

Fig. 1
Fig. 1. Serological response in alternative vaccination study groups.
A Percentage of seroresponders per randomized alternative vaccination study group, including kidney transplant recipients (KTRs) and healthcare workers (HCWs), at 28 days after vaccination. Seroresponders for KTRs were defined as having a S1-specific IgG antibody level >10 BAU/mL, measured using a validated fluorescent bead-based multiplex immunoassay, and for HCWs >33.8 BAU/ml, as measured by the Liaison TrimericS IgG assay; p values were determined using the χ2 test. B SARS-CoV-2 S1-specific serum IgG antibody levels at baseline and 28 days after vaccination. Each participant is depicted by dots, and the dashed line represents the seropositivity thresholds. The p-values between groups were calculated using the Mann-Whitney U test, and the Wilcoxon Signed Rank test for intra-group comparisons. NS, no significance; *, p < 0.05; **, p < 0.01; ***, p < 0.001; ****, p < 0.0001.
Fig. 2
Fig. 2. T-cell response in the alternative vaccination study groups.
A Percentage of T-cell responders per randomized alternative vaccination study group at 28 days after vaccination. T-cell responders were defined as participants with an IFN-γ concentration >0.15 IU/mL; p-values were calculated using the χ2 test. B IFN-γ concentrations at baseline and 28 days after vaccination. Each participant is depicted by dots, with the dotted line indicating the cutoff value for T-cell response. The p-values between groups were calculated using the Mann-Whitney U test, and the Wilcoxon Signed Rank test for intra-group comparisons. NS, no significance; *, p < 0.05; **, p < 0.01; ***, p < 0.001; ****, p < 0.0001.
Fig. 3
Fig. 3. Antibody responder groups exhibit cytokine profiles after vaccination.
A Heatmap illustrating ln(x+1)-transformed z-scores of SARS-CoV-2 specific T-cell cytokines based on S1-specific IgG antibody response groups at 28 days post-vaccination. The color scale (red-to-blue) represents ln(x+1) T-cell cytokine values. The left banner of the heatmap indicates S1-specific IgG antibody response groups: non-responders, middle-responders, and high-responders. B Concentrations of the most differentially expressed T-cell cytokines for each antibody response group. Statistical analysis was performed using the Mann-Whitney U test to compare groups. Antibody response groups were defined based on the S1-specific IgG antibody levels at 28 days after vaccination: non-responders (S1-specific IgG <10 BAU/mL), middle-responders (S1-specific IgG 11-1000 BAU/mL), and high-responders (S1-specific IgG >1001 BAU/mL). NS, no significance; *, p < 0.05; **, p < 0.01; ***, p < 0.001; ****, p < 0.0001.
Fig. 4
Fig. 4. T-cell responders based on IFN-γ, IL-2, IL-5 or IL-13 in the alternative vaccination study groups.
Percentage of T-cell responders per randomized alternative vaccination study group at 28 days after vaccination. A T-cell responders were defined as participants with an IFN-γ concentration >0.00 pg/mL. B T-cell responders were defined as participants with an IL-2 concentration >0.00 pg/mL. C T-cell responders were defined as participants with an IL-5 concentration >0.00 pg/mL. D T-cell responders were defined as participants with an IL-13 concentration > 0.00 pg/mL. p values were calculated using the χ2 test. NS, no significance; *p<0.05; **p<0.01; ***p<0.001; ****p<0.0001.
Fig. 5
Fig. 5. Correlation between cytokines and S1-specific IgG antibodies at 28 days after vaccination.
A Correlation between IL-2 concentration and S1-specific IgG antibody levels (Spearman’s rank correlation coefficient 0.50; p<0.0001). The diagonal line represents the regression line on ln(x+1)-transformed data (beta coefficient 0.34; 95% CI 0.21 to 0.46). B IL-5 Spearman’s rank correlation coefficient 0.47; p<0.0001, beta coefficient 0.35; 95% CI 0.20 to 0.51. C IL-13 Spearman’s rank correlation coefficient 0.22; p<0.01, beta coefficient 0.22; 95% CI 0.06 to 0.39. D IL-2 concentration correlates with IL-5 concentrations 28 days after vaccination (Spearman’s rank correlation coefficient 0.73; p<0.0001). The diagonal line represents the regression line on ln(x+1)-transformed data (beta coefficient 0.66; 95% CI 0.54to 0.78). The gray shaded areas indicate the 95% CI of the best-fit line. Each symbol in the figure represents a participant.

References

    1. Hilbrands, L. B. et al. COVID-19-related mortality in kidney transplant and dialysis patients: results of the ERACODA collaboration. Nephrol. Dial. Transplant.35, 1973–1983 (2020). - PMC - PubMed
    1. Britton, A. et al. Effectiveness of COVID-19 mRNA Vaccines Against COVID-19-Associated Hospitalizations Among Immunocompromised Adults During SARS-CoV-2 Omicron Predominance - VISION Network, 10 States, December 2021-August 2022. MMWR Morb. Mortal. Wkly. Rep.71, 1335–1342 (2022). - PMC - PubMed
    1. Hovd, M. et al. Humoral vaccine response and breakthrough infections in kidney transplant recipients during the COVID-19 pandemic: a nationwide cohort study. EClinicalMedicine60, 102035 (2023). - PMC - PubMed
    1. Williamson, E. J. et al. Factors associated with COVID-19-related death using OpenSAFELY. Nature584, 430–436 (2020). - PMC - PubMed
    1. Avery, R. K. et al. Inpatient COVID-19 outcomes in solid organ transplant recipients compared to non-solid organ transplant patients: A retrospective cohort. Am. J. Transplant21, 2498–2508 (2021). - PMC - PubMed

LinkOut - more resources