

Functional connectivity between the visual and salience networks and autistic social features at school-age
- PMID: 40295911
- PMCID: PMC12036130
- DOI: 10.1186/s11689-025-09613-9
Functional connectivity between the visual and salience networks and autistic social features at school-age
Abstract
Background: Autism spectrum disorder (ASD) is highly heritable and phenotypically variable. Neuroimaging markers reflecting variation in behavior will provide insights into circuitry subserving core features. We examined functional correlates of ASD symptomology at school-age, while accounting for associated behavioral and cognitive domains, in a longitudinal sample followed from infancy and enriched for those with a genetic liability for ASD.
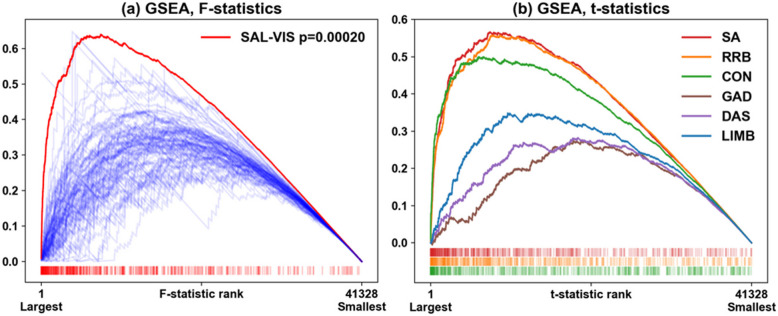
Methods: Resting state functional connectivity MRIs (fcMRI) and behavioral data were analyzed from 97 school-age children (8.1-12.0 years, 55 males, 15 ASD) with (n = 63) or without (n = 34) a family history of ASD. fcMRI enrichment analysis (EA) was used to screen for associations between network-level functional connectivity and six behaviors of interest in a data-driven manner: social affect, restricted and repetitive behavior (RRB), generalized anxiety, inattention, motor coordination, and matrix reasoning.
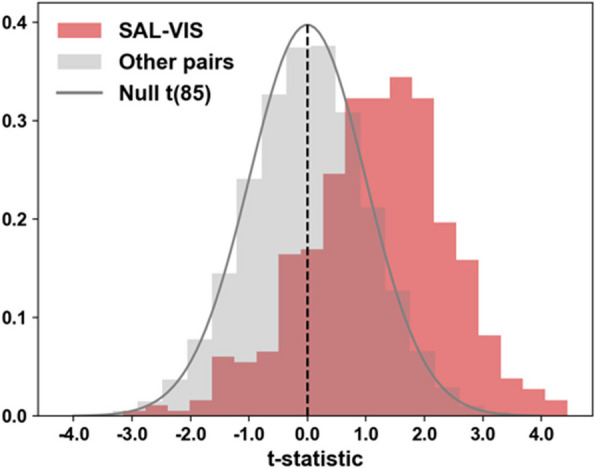
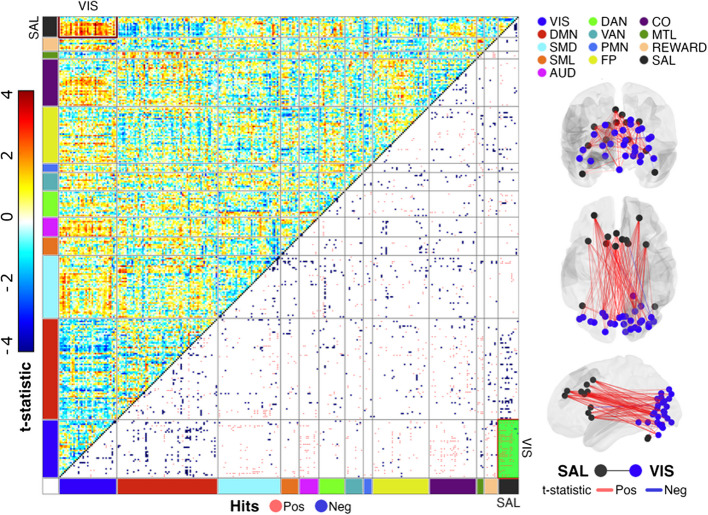
Results: Functional connectivity between the visual and salience networks was significantly associated with social affect symptoms at school-age after accounting for all other behaviors. Results indicated that stronger connectivity was associated with higher social affect scores. No other behaviors were robustly associated with functional connectivity, though trends were observed between visual-salience connectivity and RRBs.
Conclusions: Connectivity between the visual and salience networks may play an important role in social affect symptom variability among children with ASD and those with genetic liability for ASD. These findings align with and extend earlier reports in this sample of the central role of the visual system during infancy in ASD.
Keywords: Autism; Brain networks; Functional connectivity; MRI; Social behavior.
© 2025. The Author(s).
Conflict of interest statement
Declarations. Ethics approval and consent to participate: Informed consent was provided by all participating families. Study procedures were approved by the Institutional Review Boards (IRB) at each research site: University of North Carolina at Chapel Hill, Washington University in St. Louis, University of Washington in Seattle, and the Children’s Hospital of Philadelphia. A single governing IRB at UNC Chapel Hill was in place (IRB #17–1871, PI: Piven). Consent for publication: Not applicable. Competing interests: Dr. Robert McKinstry serves on the medical advisory board and receives stock options for Turing Medical; he also receives funding for meals and travel from Siemens Healthineers, Philips Healthcare, RadiAction Medical, and meals from Hyperfine, Inc. Abraham Z. Snyder is a consultant for Sora Neuroscience, LLC. A.M. Shen discloses a familial relationship with M.D. Shen, but their institution’s COI Office has determined there is no scientific or financial conflict of interest. All other authors report no financial relationships with commercial interests.
Figures
References
-
- Maenner MJ, Warren Z, Williams AR, Amoakohene E, Bakian AV, Bilder DA, et al. Prevalence and Characteristics of Autism Spectrum Disorder Among Children Aged 8 Years — Autism and Developmental Disabilities Monitoring Network, 11 Sites, United States, 2020. MMWR Surveill Summ. 2023;72:1–14. - DOI - PMC - PubMed
MeSH terms
Grants and funding
LinkOut - more resources
Full Text Sources
Medical
