. 2025 Apr 28;25(1):554.
doi: 10.1186/s12870-025-06588-6.

Identification of QTLs associated with grain yield-related traits of spring barley

Affiliations

Identification of QTLs associated with grain yield-related traits of spring barley

Yuliya Genievskaya et al. BMC Plant Biol. .

Abstract

Background: Numerous quantitative trait loci (QTLs) and candidate genes associated with yield-related traits have been identified in barley by genome-wide association study (GWAS) analysis. However, genetic bottlenecks in elite cultivars have reduced diversity, limiting further yield improvements. Grain yield is a complex, polygenic trait shaped by genetic and environmental factors, necessitating integrative breeding approaches. While genomic selection, marker-assisted selection, and GWAS have identified key loci for yield-related traits, functional validation remains a significant challenge.

Results: A total of 346 QTLs for seven barley yield-related traits were identified in GWAS, including 93 stable QTLs across multiple environments. Two major-effect QTLs for spike length and thousand kernel weight, along with several moderate-effect QTLs, show potential for breeding. Candidate gene analysis revealed 134 highly expressed genes linked to stress response, transport, and metabolism. Notable genes include HORVU.MOREX.r3.5HG0514790 (growth and stress adaptation) and HORVU.MOREX.r3.2HG0212810 (seed storage protein). A total of eight presumably novel QTLs were identified. One of the novel QTLs, Hv_TKW_3H.5, had the strongest effect on total barley grain yield. The integration of favorable alleles from eight moderate- and major-effect QTLs significantly influenced the weight of kernels per spike.

Conclusions: This study aimed to identify and characterize QTLs associated with barley yield-related traits through GWAS. Integrating genomic and transcriptomic methods suggests a promising strategy for genomic selection and marker-assisted breeding to enhance barley grain yield.

Keywords: Candidate genes; Expression; GWAS; Gene combinations; SNP; Transcriptome analysis.


Conflict of interest statement

Declarations. Ethics approval and consent to participate: Not applicable. Consent for publication: Not applicable. Competing interests: The authors declare no competing interests.

Figures

Fig. 1
Fig. 1
Distribution of values of seven yield-related traits (BLUP) and correlation coefficients among them. NKS– number of kernels per spike, NPS– number of productive spikes, SD– spike density, SL– spike length, TKW– thousand kernels weight, WKP– the weight of kernels per plant, WKS– the weight of kernel per spike
Fig. 2
Fig. 2
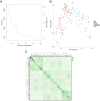
Population structure of 273 barley accessions. A– Scree plot of principal component analysis. B– PCA plot. С– Heat map of kinship matrix with clusterization
Fig. 3
Fig. 3
A– Number of MTAs identified among three environments and BLUP. B– Number of stable QTLs by environments. C– Positions of QTLs and proportion of variation in a trait they explain. NKS– number of kernels per spike, NPS– number of productive spikes, SD– spike density, SL– spike length, TKW– thousand kernels weight, WKP– the weight of kernels per plant, WKS– the weight of kernels per spike
Fig. 4
Fig. 4
Distributions of QTLs on chromosomes 1H, 2H, and 3H. NKS– number of kernels per spike, NPS– number of productive spikes, SD– spike density, SL– spike length, TKW– thousand kernels weight, WKP– the weight of kernels per plant, WKS– the weight of kernels per spike
Fig. 5
Fig. 5
Distributions of QTLs on chromosomes 4H, 5H, 6H, and 7H. NKS– number of kernels per spike, NPS– number of productive spikes, SD– spike density, SL– spike length, TKW– thousand kernels weight, WKP– the weight of kernels per plant, WKS– the weight of kernels per spike
Fig. 6
Fig. 6
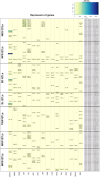
Expression heatmap of the candidate genes in QTLs associated with seven yield-related traits. CAR15– Grain, bracts removed, 15 days post-anthesis; CAR5– Grain, bracts removed, 5 days post-anthesis; EMB– Embryos, 4 days dissected from germinating grains; EPI– 4-week-old epidermis; ETI– 10-day-old etiolated seedling; INF1– Young inflorescences, 5 mm; INF2– Inflorescences, 1–1.5 cm; LEA– 10 cm shoot from the seedlings; LEM– Lemma, 6 weeks post-anthesis; LOD– Lodicule, 6 weeks post-anthesis; NOD– Six-leaf stage developing tillers; PAL– Palea, 6 weeks post-anthesis; RAC– Rachis, 5 weeks post-anthesis; ROO– 4-week-old root; ROO2– Roots from 10 cm seedlings; SEN– 2-month-old senescing leaf; NKS– number of kernels per spike, NPS– number of productive spikes, SD– spike density, SL– spike length, TKW– thousand kernels weight, WKP– the weight of kernels per plant, WKS– the weight of kernels per spike
Fig. 7
Fig. 7
Expression of the candidate genes in QTLs by barley plant organs at different developmental stages and organs CAR15– Grain, bracts removed, 15 days post-anthesis; CAR5– Grain, bracts removed, 5 days post-anthesis; EMB– Embryos, 4 days dissected from germinating grains; EPI– 4-week-old epidermis; ETI– 10-day-old etiolated seedling; INF1– Young inflorescences, 5 mm; INF2– Inflorescences, 1–1.5 cm; LEA– 10 cm shoot from the seedlings; LEM– Lemma, 6 weeks post-anthesis; LOD– Lodicule, 6 weeks post-anthesis; NOD– Six-leaf stage developing tillers; PAL– Palea, 6 weeks post-anthesis; RAC– Rachis, 5 weeks post-anthesis; ROO– 4-week-old root; ROO2– Roots from 10 cm seedlings; SEN– 2-month-old senescing leaf; NKS– number of kernels per spike, NPS– number of productive spikes, SD– spike density, SL– spike length, TKW– thousand kernels weight, WKP– the weight of kernels per plant, WKS– the weight of kernels per spike
Fig. 8
Fig. 8
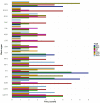
GO analysis of candidate genes categorized by their associated biological processes. NKS– number of kernels per spike, NPS– number of productive spikes, SD– spike density, SL– spike length, TKW– thousand kernels weight, WKP– the weight of kernels per plant, WKS– the weight of kernels per spike
Fig. 9
Fig. 9
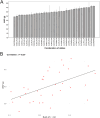
Impact of combination of positive alleles of major- and moderate-effect QTLs on WKP. A– Mean WKP values (BLUP) across different combinations. B– Correlation between mean WKP (BLUP) and the summed r × R² per combination

Similar articles

Cited by

References

    1. Ray DK, Mueller ND, West PC, Foley JA. Yield trends are insufficient to double global crop production by 2050. PLoS ONE. 2013;8(6):e66428. - PMC - PubMed
    1. Tilman D, Balzer C, Hill J, Befort BL. Global food demand and the sustainable intensification of agriculture. Proc Natl Acad Sci USA. 2011;108(50):20260–4. - PMC - PubMed
    1. FAO. The Food and Agriculture Organization of the United Nations. https://www.fao.org/home/en/ (2023). Accessed 20 Jan 2025.
    1. Tanksley SD, McCouch SR. Seed banks and molecular maps: unlocking genetic potential from the wild. Science. 1997;277(5329):1063–6. - PubMed
    1. Haudry A, Cenci A, Ravel C, et al. Grinding up wheat: a massive loss of nucleotide diversity since domestication. Mol Biol Evol. 2007;24(7):1506–17. - PubMed

LinkOut - more resources