. 2025 Apr 28;25(1):303.
doi: 10.1186/s12876-025-03920-0.

Unveiling the heterogeneity and immunotherapy potency of tumor-associated neutrophils in the tumor microenvironment of gastric cancer

Affiliations

Unveiling the heterogeneity and immunotherapy potency of tumor-associated neutrophils in the tumor microenvironment of gastric cancer

Tong-Tong Qi et al. BMC Gastroenterol. .

Abstract

Background: The differentiation characteristics of neutrophils within the gastric cancer (GC) tumor microenvironment (TME) and their interactions with malignant gastric epithelial cells require further investigation. Furthermore, the therapeutic potential of tumor-associated neutrophils (TANs) in immunotherapy remains inadequately explored.

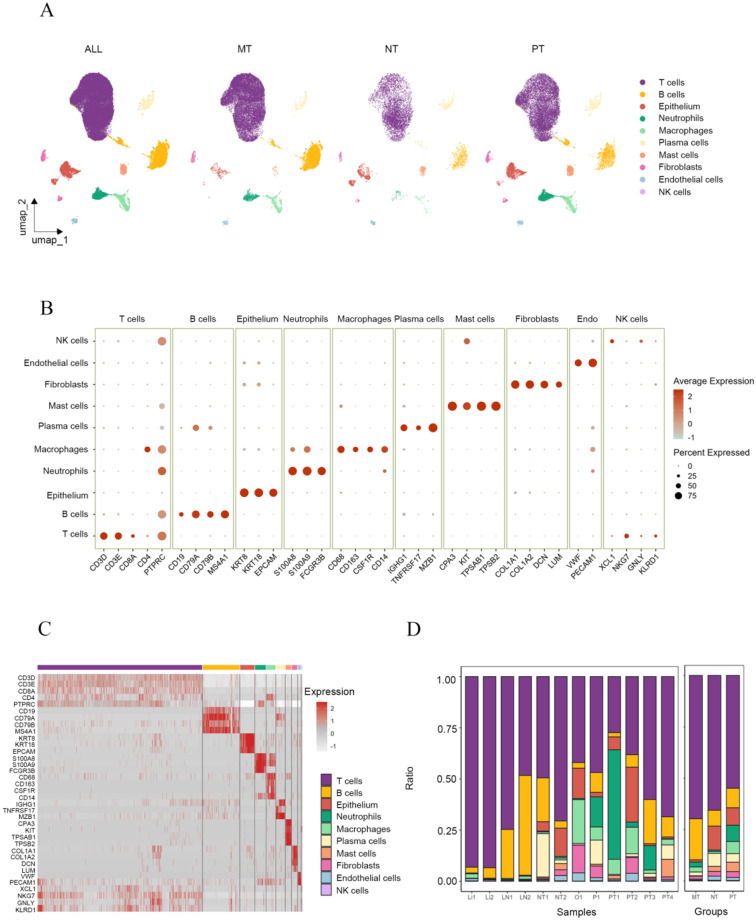
Methods: We integrated two single-cell transcriptome datasets comprising 12 samples, including gastric primary tumors, non-tumor tissues, and metastatic tumors, to profile the epithelial cells and TANs atlas within the TME and examine their interaction modules. In addition, these data were integrated with the bulk transcriptomic including the Cancer Genome Atlas - Stomach Adenocarcinoma (TCGA-STAD) and Asian Cancer Research Group (ACRG) datasets to analyze the expression levels of neutrophil-associated genes across the tumor-associated neutrophil subsets.

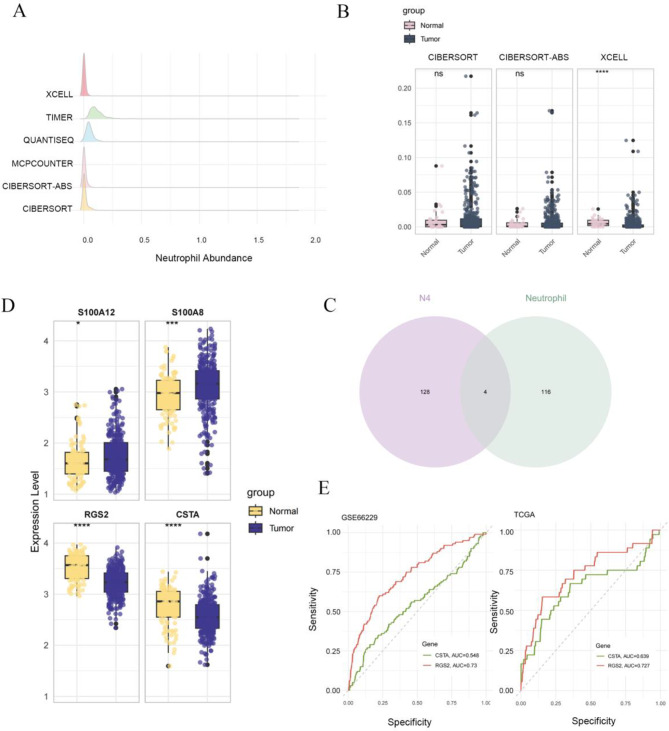
Results: We analyzed 3,118 gastric epithelial cells and 2,365 TANs from all samples. Epithelial cells were classified into ten subclusters, while TANs were grouped into five subclusters. In gastric primary tumors, epithelial cell subtypes included primarily MUC16 + and stem-like populations. In metastatic tumors, the epithelial cell subset with high CXCL5 expression was a characteristic subtype. TANs mainly interacted with epithelial cells via the LGALS9-CD45 and CD46-JAG1 pathways. And RGS2 was highly expressed in N4, a tumor-associated neutrophils subcluster characterized by high MMP9 expression, highlighting its potential as an immunotherapy target.

Conclusion: TANs exhibit robust interactions with gastric malignant epithelial cell subsets. Furthermore, RGS2, which is highly expressed in N4, could serve as a promising target for immunotherapy.

Keywords: Gastric cancer; Gastric metastatic tumor; ScRNAseq; Tumor microenvironment; Tumor-associated neutrophils.


Conflict of interest statement

Declarations. Ethics approval and consent to participate: This study was based entirely on publicly available datasets. No experiments involving human participants or animals were conducted by the authors. Consent for publication: Not applicable. Competing interests: The authors declare no competing interests.

Figures

Fig. 1
Fig. 1
Overview of the single-cell transcriptome landscape for non-tumor tissues, primary tumors and metastatic tumors in GC. A UMAP plot showing the annotation of all cells from NTs, PTs and MTs into ten major cell types and the distribution of each cell type in NTs, PTs and MTs, highlighting the abundance variations among these groups. B Bubble diagram illustrating the expression levels of canonical gene markers in various cell populations. C Heatmap illustrating the expression levels of canonical gene markers across various cell populations. Color intensity reflects relative gene expression, with higher intensity indicating higher expression levels. D Stacked bar chart displaying the percentage of cell populations in each samples and each groups
Fig. 2
Fig. 2
Functional characteristics and changes of epithelial subclusters within the TME of GC. A-B UMAP plot and bar chart showing the distribution and proportion of each subcluster across groups. C The CNV profiles of each subcluster in three groups, using chief cells and endocrine cells in NTs as reference cells. D Dot plot showing the canonical marker genes of epithelial subtypes. E UMAP and boxplot illustrating the Gastric cancer score of each epithelial cell subcluster. F GO and KEGG enrichment analyses of MUC16 + epithelium
Fig. 3
Fig. 3
Differentiation and metabolic characteristics of epithelial subclusters within the TME of GC. A Pseudotime analysis diagram displaying the differentiation trajectory of each epithelial subset. B Significantly expressed pseudotime-related genes during epithelial cell differentiation. Colors indicate relative expression levels, with red representing high expression and blue representing low expression. C Active levels of metabolism-related pathways in each epithelial cell subcluster based on scRNA-seq data. D Box plot showing the differentiation score for each subcluster. A score closer to 1 indicates a lower differentiation status, while a score closer to 0 indicates a higher differentiation status
Fig. 4
Fig. 4
Heterogeneity of TANs within the TME of GC and gastric metastases. A UMAP plot showing the distribution of each TAN subcluster across groups. B Violin plot displaying genes specifically expressed in TANs. C Top 10 DEGs in each TANs subcluster. D Stacked bar chart showing the proportion of each TAN subcluster across groups. E Pseudotime analysis illustrating the differentiation trajectory of each TAN subcluster. F Significantly expressed pseudotime-related genes during TANs differentiation. Colors indicate relative expression levels, with red representing high expression and blue representing low expression. G GO enrichment analyses of N0 cluster. H Box plot showing the differentiation score for each subcluster
Fig. 5
Fig. 5
Cell-cell interactions between epithelial cells and TANs. A The number and strength of communications between in epithelial and TAN subsets. B Heatmap showing the relative strength of specific incoming and outgoing signaling pathways between epithelial and TAN subsets. Color intensity reflects relative gene expression, with higher intensity indicating higher expression levels. C Hierarchical clustering illustrating distinct signaling pathways in the TME of gastric primary tumors. D Dot plot displaying detailed ligand-receptor communication probabilities targeting specific cell subsets. E Clustering analysis of communication patterns of secreting cells and target cells
Fig. 6
Fig. 6
Identification of gene markers for TAN subsets. A Evaluation of neutrophil abundance in TCGA-STAD data using six algorithms. B Box plot displaying the differential expression of TAN abundance cross three algorithms. C Venn diagram illustrating overlap down-regulated genes in gastric tumors from TCGA and DEGs in the N4 subset. D Expression levelS of four selected genes in GSE66229 dataset. E ROC curves calculating the diagnostic potential of CSTA and RGS2 in two datasets

Similar articles

Cited by

References

    1. Ward ZJ, Gaba Q, Atun R. Cancer incidence and survival for 11 cancers in the commonwealth: a simulation-based modelling study. Lancet Oncol. 2024;25(9):1127–34. - PubMed
    1. He Y, Wang Y, Luan F, et al. Chinese and global burdens of gastric cancer from 1990 to 2019. Cancer Med. 2021;10(10):3461–73. - PMC - PubMed
    1. Fitzsimmons D, Osmond C, George S, et al. Trends in stomach and pancreatic cancer incidence and mortality in England and Wales, 1951–2000. Br J Surg. 2007;94(9):1162–71. - PubMed
    1. Johnston FM, Beckman M. Updates on management of gastric Cancer. Curr Oncol Rep. 2019;21(8):67. - PubMed
    1. llemani C, Matsuda T, Di Carlo V, et al. Global surveillance of trends in cancer survival 2000-14 (CONCORD-3): analysis of individual records for 37 513 025 patients diagnosed with one of 18 cancers from 322 population-based registries in 71 countries. Lancet. 2018;391(10125):1023–75. - PMC - PubMed