

Incomplete lineage sorting and introgression among genera and species of Liliaceae tribe Tulipeae: insights from phylogenomics
- PMID: 40296048
- PMCID: PMC12039212
- DOI: 10.1186/s12915-025-02204-z
Incomplete lineage sorting and introgression among genera and species of Liliaceae tribe Tulipeae: insights from phylogenomics
Abstract
Background: Phylogenetic research in Tulipa (Liliaceae), a genus of significant economic and horticultural value, has relied on limited nuclear (mostly nuclear ribosomal internal transcribed spacer, nrITS) and plastid DNA sequences, resulting in low-resolution phylogenetic trees and uncertain intrageneric classifications. The genus, noted for its large genome, presents discordant relationships among Amana, Erythronium, and Tulipa, likely due to incomplete lineage sorting (ILS) and/or reticulate evolution. Thus, phylogenomic approaches are needed to clarify these relationships and the conflicting signals within the tribe Tulipeae.
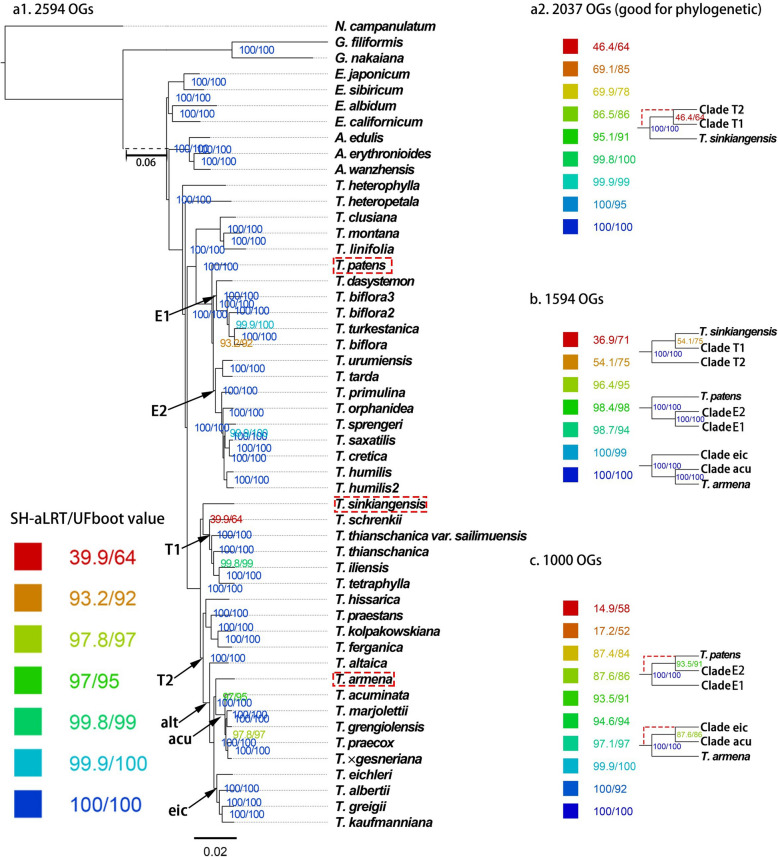
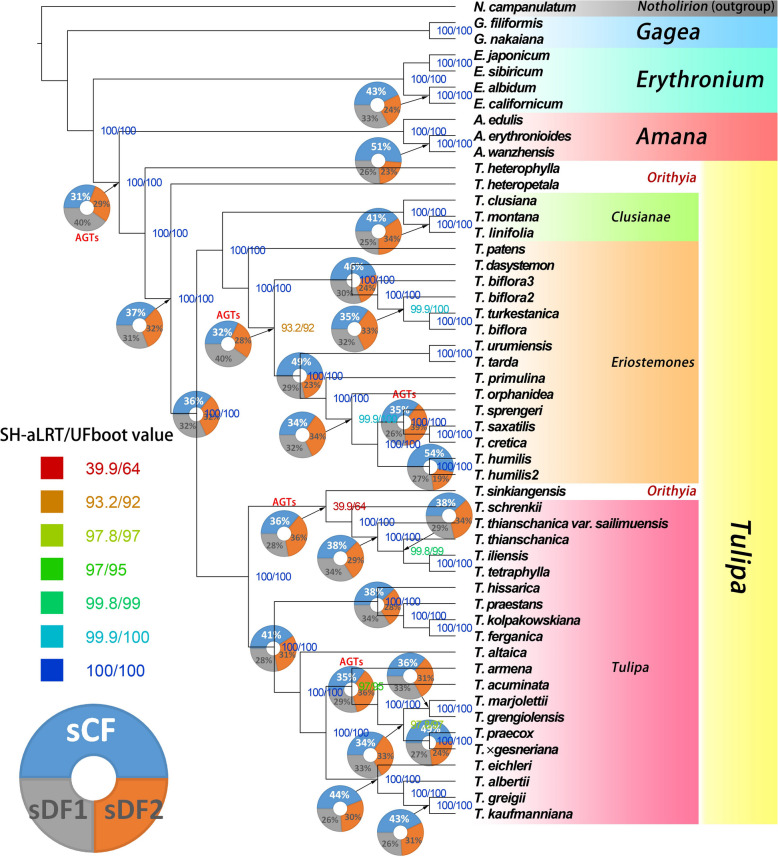
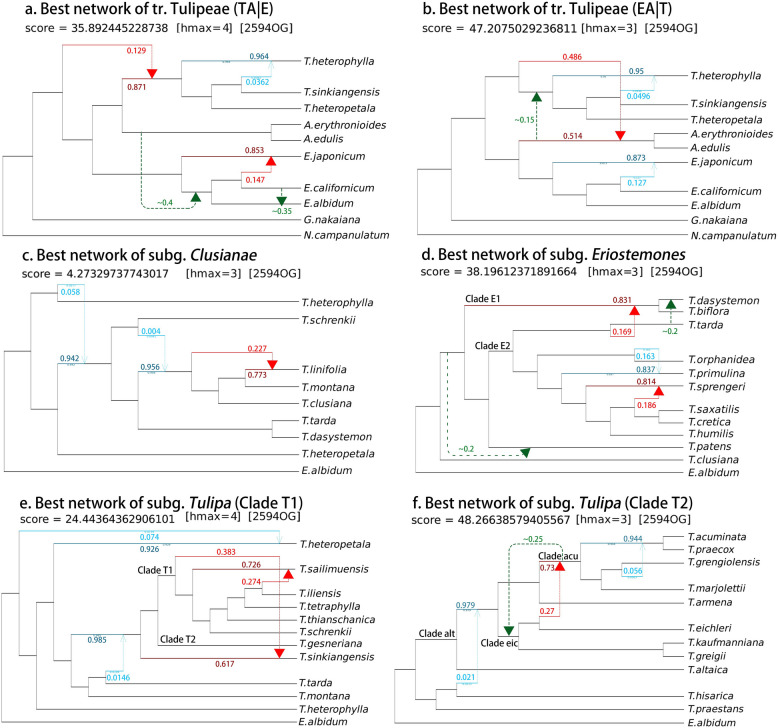
Results: We newly sequenced 50 transcriptomes of 46 species of tribe Tulipeae (including multiple accessions of all four genera) and one outgroup species of the sister tribe Lilieae (Notholirion campanulatum), and downloaded 15 previously published transcriptomes of tribe Tulipeae to supplement the sampling. One plastid dataset (74 plastid protein-coding genes, PCGs) and one nuclear dataset (2594 nuclear orthologous genes, OGs) were constructed, with the latter used for species tree inference based on maximum likelihood (ML) and multi-species coalescent (MSC) methods. To investigate causes of gene tree discordance, "site con/discordance factors" (sCF and sDF1/sDF2) were calculated first, after which phylogenetic nodes displaying high or imbalanced sDF1/2 were selected for phylogenetic network analyses and polytomy tests to determine whether ILS or reticulate evolution best explain incongruence. Key relationships not resolved by this technique, especially those among Amana, Erythronium, and Tulipa, were further investigated by applying D-statistics and QuIBL.
Conclusions: We failed to reconstruct a reliable and unambiguous evolutionary history among Amana, Erythronium, and Tulipa due to especially pervasive ILS and reticulate evolution, likely caused either by obscured minority phylogenetic signal or differing signals among genomic compartments. However, within Tulipa we confirmed the monophyly of most subgenera, with the exception of two species in the small subgenus Orithyia, of which Tulipa heterophylla was recovered as sister to the remainder of the genus, whereas T. sinkiangensis clustered within subgenus Tulipa. In contrast, most traditional sections of Tulipa were found to be non-monophyletic.
Keywords: Incomplete lineage sorting (ILS); Introgression; Phylogeny; Reticulate evolution; Transcriptome sequencing; Tulipeae.
© 2025. The Author(s).
Conflict of interest statement
Declarations. Ethics approval and consent to participate: Not applicable. Consent for publication: Not applicable. Competing interests: The authors declare no competing interests.
Figures


References
-
- Christenhusz MJM, Govaerts R, David JC, Hall T, Borland K, Roberts PS, Tuomisto A, Buerki S, Chase MW, Fay MF. Tiptoe through the tulips - cultural history, molecular phylogenetics and classification of Tulipa (Liliaceae). Bot J Linn Soc. 2013;172(3):280–328.
-
- Tan D. The systematics of Tulipa L.(SL) from China[in Chinese]. Chinese Academy of Sciences. 2005.
-
- Chao C, Tzeng H, Tseng Y. On the Review of Taxonomic Status of Liliaceae. Quarterly Journal of Forest Research. 2015;37:143–60.
-
- Chase MW, Christenhusz MJM, Fay MF, Byng JW, Judd WS, Soltis DE, Mabberley DJ, Sennikov AN, Soltis PS, Stevens PF, et al. An update of the Angiosperm Phylogeny Group classification for the orders and families of flowering plants: Apg IV. Bot J Linn Soc. 2016;181(1):1–20.
MeSH terms
Grants and funding
- 31970225/National Natural Science Foundation of China
- 31970225/National Natural Science Foundation of China
- 31970225/National Natural Science Foundation of China
- 31970225/National Natural Science Foundation of China
- 31970225/National Natural Science Foundation of China
- 31970225/National Natural Science Foundation of China
- 31970225/National Natural Science Foundation of China
- 31970225/National Natural Science Foundation of China
- 31970225/National Natural Science Foundation of China
- 31970225/National Natural Science Foundation of China
- 2023C03138/Key Technology Research and Development Program of Zhejiang Province
- 2023C03138/Key Technology Research and Development Program of Zhejiang Province
- 2023C03138/Key Technology Research and Development Program of Zhejiang Province
- 2023C03138/Key Technology Research and Development Program of Zhejiang Province
- 2023C03138/Key Technology Research and Development Program of Zhejiang Province
- 2023C03138/Key Technology Research and Development Program of Zhejiang Province
- 2023C03138/Key Technology Research and Development Program of Zhejiang Province
- 2023C03138/Key Technology Research and Development Program of Zhejiang Province
- 2023C03138/Key Technology Research and Development Program of Zhejiang Province
- 2023C03138/Key Technology Research and Development Program of Zhejiang Province
LinkOut - more resources
Full Text Sources
